


Bitcoin Volatility Calms to Match Nvidia, Still Lags Euro
Is Bitcoin Becoming More Stable?
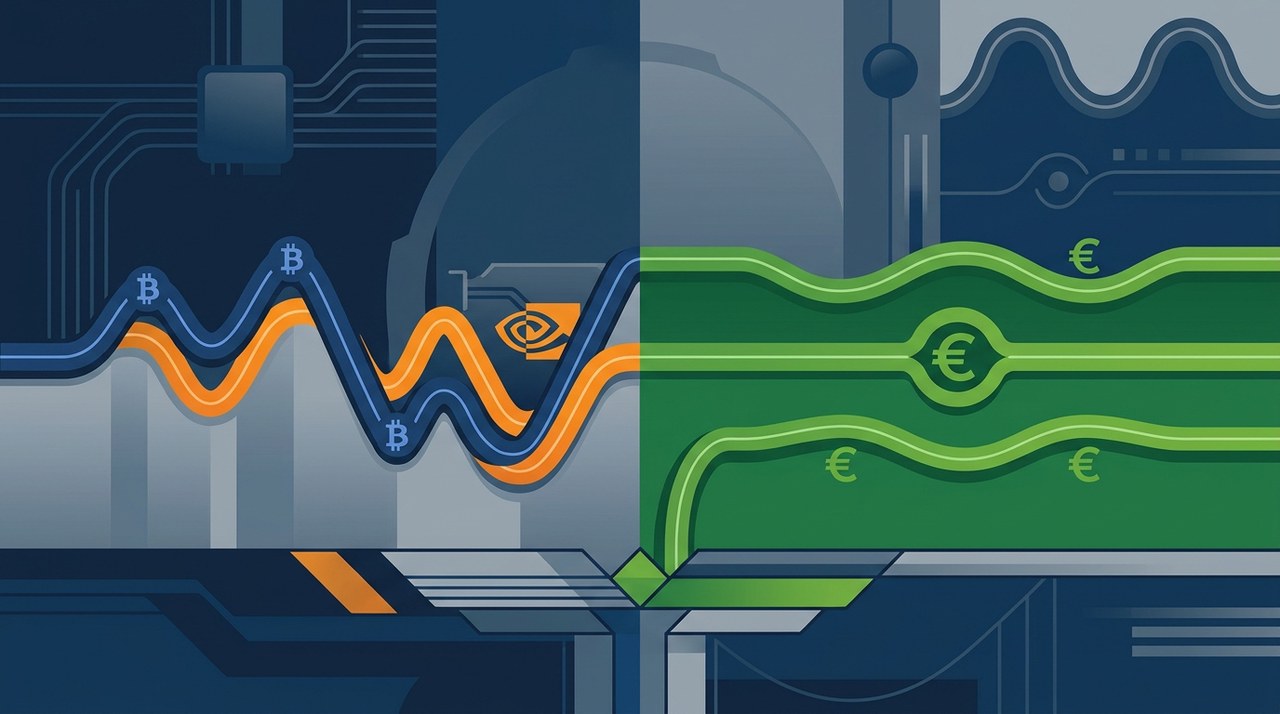
If you have been following cryptocurrency for a while, you know it has a reputation for wild price swings. However, recent market data reveals that Bitcoin (BTCBTC+0.00%) has been steadily settling down. In fact, its price movement now closely mirrors that of artificial intelligence stock giant Nvidia rather than an unpredictable speculative token.
Risk management strategies around Bitcoin have steadily gained popularity among professional investors. But how does Bitcoin's price stability compare when placed side by side with traditional safe havens like gold, mainstream stock indices, or global fiat currencies?
Measuring the Movement: How Bitcoin Compares Across Assets
To measure asset stability, analysts use a standard financial metric called 90-day realized volatility. This gauge measures how much an asset's price fluctuates over a three-month period and annualizes the result. A higher percentage indicates bigger swings and greater perceived investment risk.
Bitcoin's 90-day realized volatility stood at approximately 38%. Here is how that stacks up against major global asset classes:
- Nvidia (NVDA): ~37% — Bitcoin's closest traditional market equivalent, swinging by almost the exact same percentage.
- Gold: ~23.5% — The traditional precious metal remains noticeably calmer than Bitcoin.
- S&P 500 Index: ~11% — Mainstream U.S. equities are roughly three times less volatile than Bitcoin.
- EUR/USD Currency Pair: ~4.6% — The most liquid fiat currency pair in the world is about eight times more stable than Bitcoin.
Even with recent political uncertainty in Europe and fluctuations in French government debt, the euro-dollar pair stayed in tight single-digit volatility. Most major fiat currency pairs consistently remain below 10% realized volatility. This demonstrates that despite Bitcoin's fixed supply cap, it still has significant progress to make before matching the stability of everyday paper currencies.
Bitcoin's Multi-Year Volatility Trajectory
Although Bitcoin is jumpier than traditional stock indices or currency markets, looking back over several years reveals a clear long-term smoothing trend. Since January 2020, Bitcoin's 90-day realized volatility has averaged around 58%.
During extreme market stress in June 2020, Bitcoin's volatility peaked at 134%. Conversely, its calmest period recorded was 27.5% in September 2025, when prices traded above $100,000.
Past performance of digital assets or past operational results is no guarantee of future performance or results.
These numbers show that while Bitcoin now behaves much like a large-cap technology stock, market participants should remain mindful of inherent market shifts.
Looking Ahead: Bitcoin's BVIV vs. Wall Street's VIX
While realized volatility measures past price behavior, traders use implied volatility indices to estimate expected price turbulence over the next 30 days.
An interesting split has emerged between traditional equity markets and crypto derivatives:
- Wall Street's VIX Index: Has climbed above its 200-day moving average, indicating that equity traders are pricing in wider price swings and higher uncertainty.
- Bitcoin's BVIV Index: Volmex's 30-day Bitcoin implied volatility index remains below its 200-day moving average, pointing toward expectations of relative stability in crypto.
Whether Bitcoin can maintain its relative calm if traditional stock markets face prolonged pressure remains an important trend for market participants to monitor.
Key Market Briefings and Trending Headlines
Beyond volatility metrics, several major developments across banking, regulations, and macroeconomics are shaping the digital asset ecosystem:
1. Corporate Adoption & Real-World Assets
- HSBC Launches Red Coin: Global banking giant HSBC introduced its Hong Kong dollar stablecoin, 'Red Coin,' on its PayMe app, reaching over 3.3 million users.
- RWA Stablecoin Research: CoinDesk Research noted that diversified real-world asset (RWA) stablecoins sustain 5-7% yields backed by private credit, while crypto-native yield rates compress to ~4%. The addressable market is projected to reach $4 billion within three years.
2. Regulatory & Security Inquiries
- U.S. Senate TetherUSDT+0.12% Investigation: Senator Richard Blumenthal requested information regarding payments made by Tether to Bo Hines' firm during his tenure as a White House crypto adviser.
- Exchange Security Dispute: CoinDCX, India's largest exchange, denied new hack reports following $16 million in suspicious outflows, attributing them to previously compromised 2025 addresses. On-chain investigator ZachXBT disputed the exchange's explanation.
3. Macroeconomic & Altcoin Updates
- Tech Sector Pullback: The Nasdaq fell 2.6% in its worst single-day performance since June, driven by a 7% drop in Meta shares over AI capital expenditure concerns.
- Energy Policy: President Trump invoked the Defense Production Act to support U.S. oil production and refining, as WTI crude oil prices hovered near $100 per barrel.
- Market Snapshot: Bitcoin held steady near $81,000–$81,700 as altcoins saw selective rebounds, including a 13% gain for Pepe. Meanwhile, CardanoADA+0.37% token holders were asked to consider a $5 million community proposal tied to copper markets, and EthereumETH+0.24% developers delayed the Glamsterdam testnet to address contract security risks.
Latest blog posts


XRP Ledger Payment Volume Jumps 119.6% as Activity Surges
XRP Ledger payment volume surged 119.6% in 24 hours to 770.6 million XRP. Here is what the metrics mean for the network and price.
|
Heatbit Unveils Bitwater: A Bitcoin Mining Water Heater
Heatbit has announced Bitwater, a replacement water heater element that mines Bitcoin while heating household water.
|
Has Bitcoin Broken Its Midterm Election Pattern?
Historically, Bitcoin hits bear market bottoms right after U.S. midterm elections. In 2026, the floor arrived much earlier.
|