
Bitcoin Price Drops Near $81.6K: Will $80,000 Support Hold?
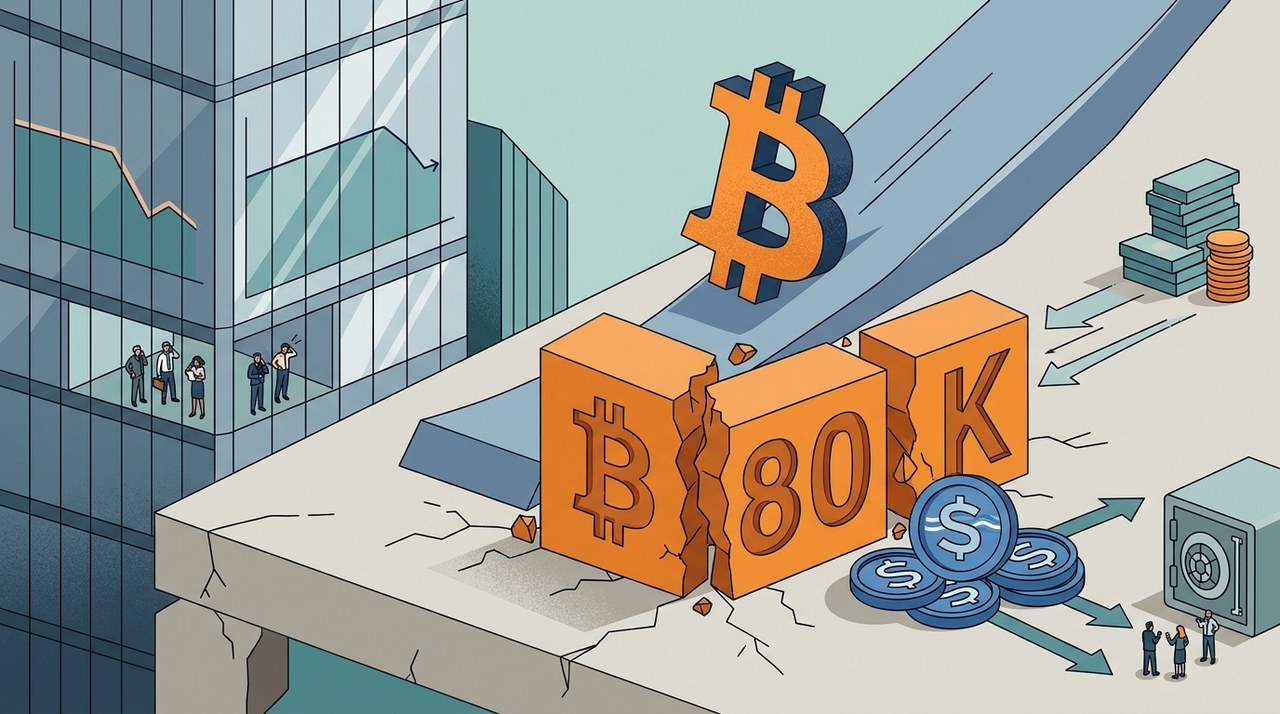
Bitcoin has given back its recent gains after running into strong resistance near $85,000. The leading cryptocurrency dropped roughly 4% to reach an intraday low of $81,652 on the Bybit exchange. On-chain metrics and chart patterns now highlight $80,000 as the next big test for the market.
A lack of aggressive buyers and slowing upward momentum could make this price level crucial over the coming days.
Why $80,000 Matters to Corporate Bitcoin Treasuries
Companies that hold Bitcoin on their balance sheets have an average purchase price of roughly $80,000, according to data from Glassnode. Bitcoin has managed to close above this level every day since September 18.
However, corporate buying has slowed down dramatically. Monthly net purchases have fallen to just a few thousand BTCBTC-2.76%, which is well below the peak levels recorded in 2025.
Glassnode explains that when companies buy Bitcoin while sitting on profits, it creates a helpful growth loop. Buying pushes the coin's price higher, which increases the company's share value and gives them more capital to buy even more Bitcoin. Right now, that positive loop has paused.
At the same time, stablecoin reserves held on crypto exchanges have fallen to a one-year low. This means there is less ready-to-use capital sitting on exchanges to cushion price dips.
If Bitcoin falls below $80,000, corporate holders would see their positions fall underwater into a loss. Back in mid-2022, a similar situation led to one of the only major periods of corporate selling recorded on Glassnode's charts.
Short-Term Holders Provide a Cushion
On a positive note, recent buyers are showing fewer signs of panic. The short-term holder (STH) realized price—which tracks the average cost basis for investors who bought recently—was $74,850 on October 21.
With Bitcoin trading near $82,000, these short-term investors remain sitting on a profit margin of around 9%.
Historically, this price line capped Bitcoin's price for much of 2026. Bitcoin was rejected at this level in May and sank below $60,000 by early July, before finally climbing back above it in late August. Maintaining a price above this metric helps keep the broader recovery structure intact.
Past performance of digital assets is not a guarantee of future results. You can view current market trends directly on Bitkub Market.
Key Technical Levels to Watch Right Now
Market analyst Ted Pillows noted that Bitcoin's weekly candle turned red after it failed to hold above $84,500. However, he pointed out that buyers haven't completely lost control because Bitcoin is still holding above its 50-day Simple Moving Average (SMA) and Exponential Moving Average (EMA).
Zooming in on the daily price chart, Bitcoin is testing its 50-day moving average at $81,835 and has dipped slightly below the 0.618 Fibonacci level at $82,614.
The 4-hour chart shows five consecutive red candles following the failed breakout above $84,000. This pull-back brought Bitcoin back to an ascending trendline starting from the October 15 low. That trendline connects with the $81,500 swing low, forming an immediate zone of support.
Short-term momentum is slowing down. The 4-hour Relative Strength Index (RSI) is sitting near 45 and has broken below a rising trendline that had been in place since October 8. However, trading volume during this drop remains lower than during the recent price rally. This suggests that the decline is caused by a lack of active buying bids rather than heavy panic selling.
Potential Scenarios for Bitcoin's Next Move
Analyst charts outline potential price paths depending on how the market reacts to these support levels:
- Downside Scenario: If the $81,500 level fails to hold, Bitcoin could test the $80,000 corporate cost basis. If selling pressure increases and breaks below $80,000, the next technical support sits at the 0.5 Fibonacci level around $77,876. A deeper correction could push prices into the $73,000 to $75,000 zone, where the 0.382 Fibonacci level and short-term holder cost basis overlap.
- Upside Scenario: If buyers step in and push the price back above $84,000, it would clear the path for another attempt at the $85,000 to $87,000 resistance zone.
Crypto markets remain dynamic and subject to short-term volatility, so traders will be watching market volume closely to see which scenario plays out.
Latest blog posts


Tether Backs Peso to Push USDT Payments in Latin America
Tether leads a pre-seed investment in Bolivian fintech Peso to expand everyday USDT retail payments across Latin America.
|


 +2
Trust Wallet Clears Rumors Over Global PHP Exploit Fallout
Trust Wallet and major Web3 protocols confirm their systems are unaffected by a critical global PHP flaw, urging users to remain vigilant against phishing scams.
|


Why Has Shiba Inu Major Burn Platform Shib Torch Stalled
Community members explain why Shib Torch is showing errors and why automated SHIB burns are temporarily paused.
|