บทความ
วิธีบริหารความเสี่ยง ปรับกลยุทธ์ให้เหมาะกับภาวะตลาด

ท่ามกลางสถานการณ์ความไม่สงบที่เกิดขึ้นในโลก ส่งผลให้ตลาดการลงทุนต่างเข้าสู่ภาวะซบเซา ตลาดคริปโทเคอร์เรนซีก็เช่นกัน ซึ่งนี่เป็นไปตามวัฏจักรของตลาดที่เกิดขึ้นอยู่เสมอ
สำหรับนักลงทุนในตลาดคริปโทฯ เราจะมีวิธีบริหารความเสี่ยงเพื่อเอาตัวรอดจากสภาวะต่าง ๆ ของตลาดอย่างไรบ้าง เรามาดู 4 วิธีบริหารความเสี่ยง ปรับกลยุทธ์ให้เหมาะกับตลาดกันเถอะ!
==========
1.ฝึกดู Graph Pattern วิเคราะห์แนวโน้มตลาด
การดูการเคลื่อนไหวของกราฟราคาหรือ Graph Pattern เรียกได้ว่าเป็นพื้นฐานที่นักเทรดสายเทคนิคต้องทำเป็น เพราะ Graph Pattern นอกจากจะช่วยวิเคราะห์ได้ว่าราคาจะไปทางไหนต่อแล้ว ยังสามารถวิเคราะห์ได้ด้วยว่าราคาจะเกิดการกลับตัวหรือไม่ นักเทรดก็จะสามารถวางกลยุทธ์ที่เหมาะสมได้กับทุกสถานการณ์
ทั้งนี้ การจะตี Graph Pattern ได้ เราต้องรู้จักการหาแนวรับ-แนวต้านก่อน โดยเบื้องต้นนั้นแนวรับ-แนวต้านเราสามารถดูได้จากระดับต่ำสุดและสูงสุดของราคาในช่วงเวลาหนึ่ง จากนั้นให้ลากเส้นจากระดับต่ำสุดหนึ่งไปอีกระดับต่ำสุดหนึ่ง เช่นเดียวกันกับระดับสูงสุด เมื่อทำเช่นนั้นแล้วเราก็จะได้เส้น 2 เส้นเป็นกรอบให้กับราคา และเราก็จะกรอบนั้นในการดู Graph Pattern นั่นเอง
Graph Pattern สามารถแบ่งออกได้เป็น 2 ประเภท คือ 1) Reversal Pattern ที่เป็นสัญญาณของการกลับตัว และ 2) Continuation Pattern ที่เป็นสัญญาณว่าราคาจะดำเนินไปในทิศทางเดิมต่อ โดยตัวอย่างที่เรามีโอกาสเห็นได้บ่อย ๆ มีดังต่อไปนี้

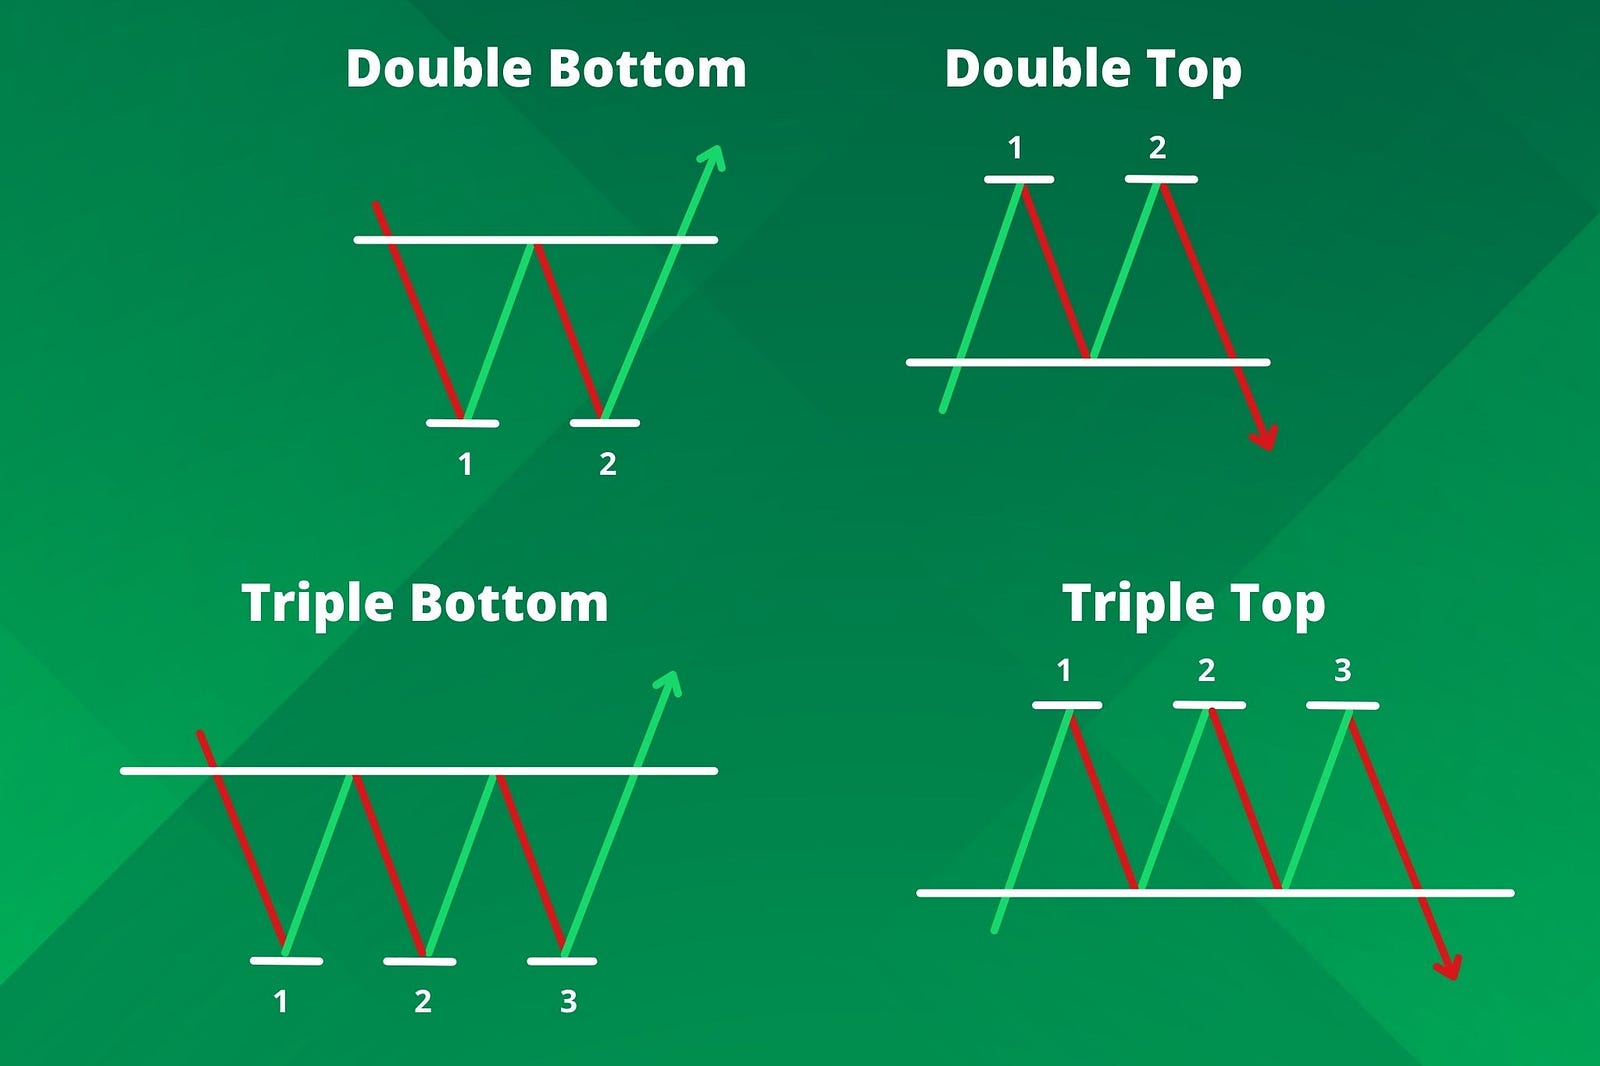
-Double Bottom / Double Top การเคลื่อนไหวแบบนี้เป็นสัญญาณของการกลับตัวของราคา ยกตัวอย่าง Double Top ซึ่งจะเป็นกรณีที่กราฟราคาวิ่งขึ้นไปชนแนวต้านแล้วเด้งลงมาติดกัน 2 ครั้งใน (กราฟจะมีลักษณะคล้ายตัว M) ซึ่งเป็นสัญญาณว่าราคาอาจกลับตัวมาลงได้ ส่วน Double Bottom ก็จะตรงกันข้ามกับ Double Top คือการที่ราคาลงมาชนแนวรับ 2 ครั้งในเวลาไล่เลี่ยกัน (กราฟจะมีลักษณะคล้ายตัว W) จึงเป็นสัญญาณว่าราคาอาจกลับตัวเป็นขาขึ้นได้

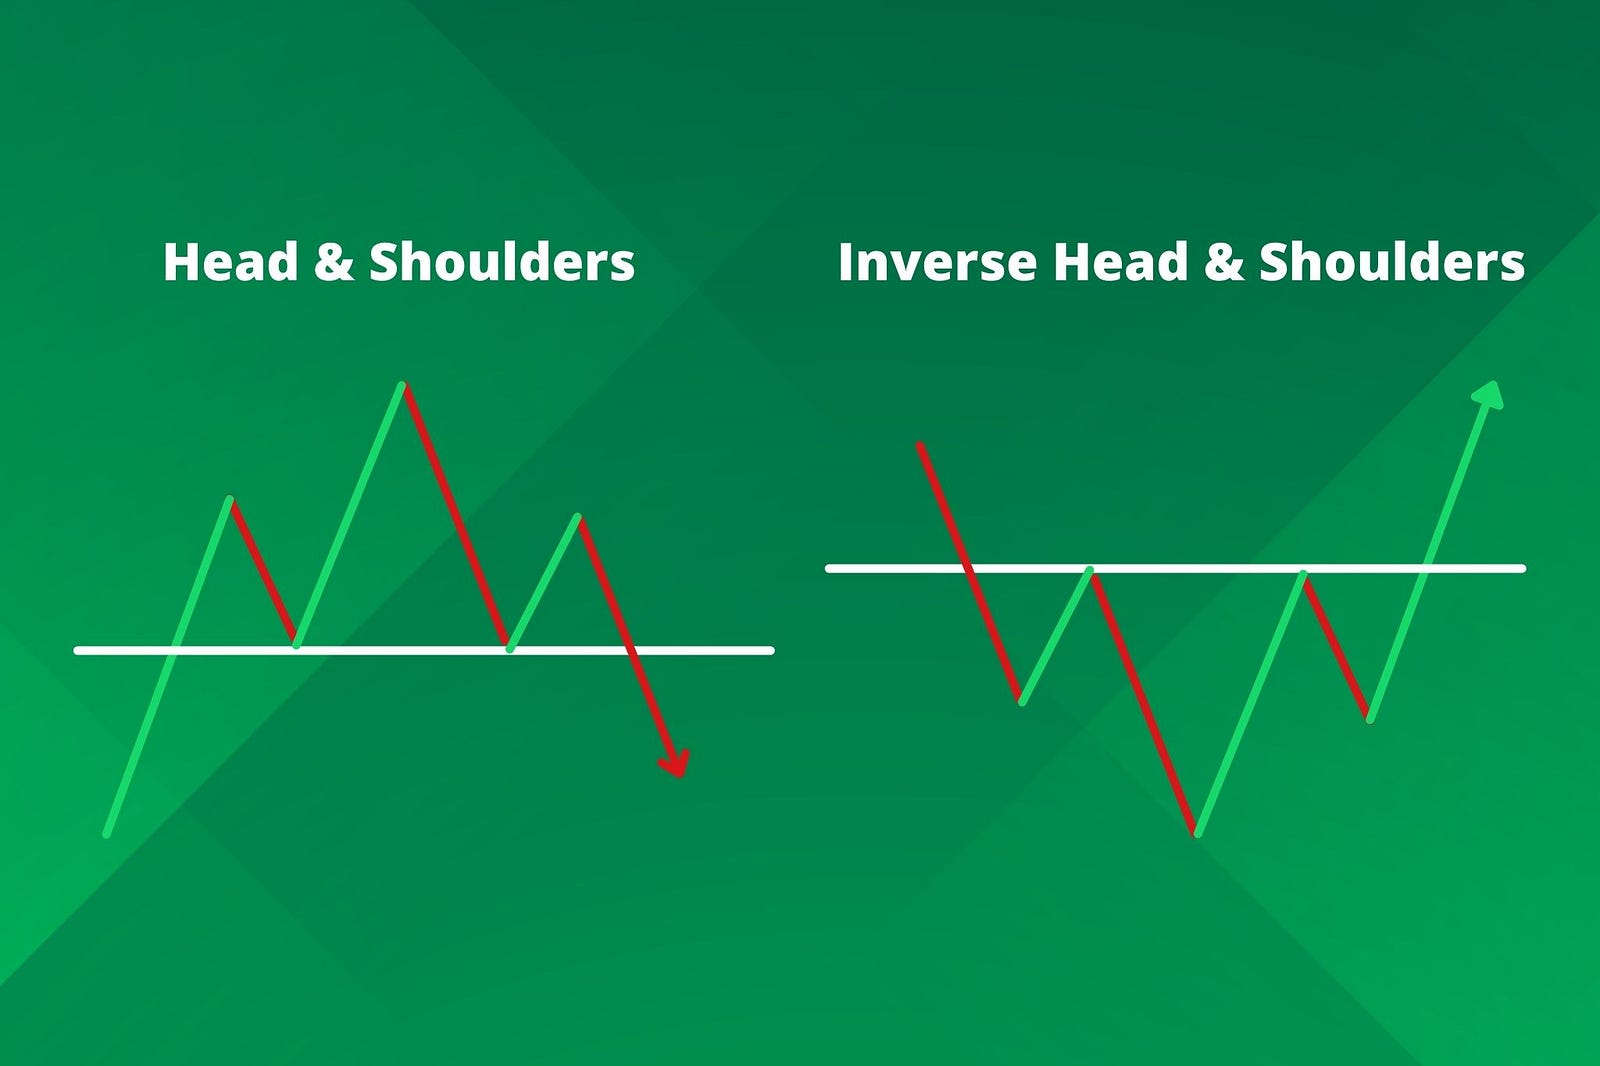
Head and Shoulders / Inverse Head and Shoulders เป็นลักษณะกราฟที่มีรูปร่างคล้ายกับหัวและไหล่ของคน กราฟแบบนี้เป็นสัญญาณว่าทิศทางที่กำลังเกิดขึ้นอาจจะสิ้นสุดในอีกไม่นาน หรือ Reversal Pattern เช่น Head and Shoulders ที่มักจะเกิดในช่วงขาขึ้น เป็นสัญญาณว่าทิศทางขาขึ้นอาจสิ้นสุดลง ขณะที่ Inverse Head and Shoulders ที่เป็นลักษณะแบบกลับหัว (Inverse) มักจะเกิดในช่วงขาลง และเป็นสัญญาณว่าขาลงกำลังจะสิ้นสุดลงนั่นเอง

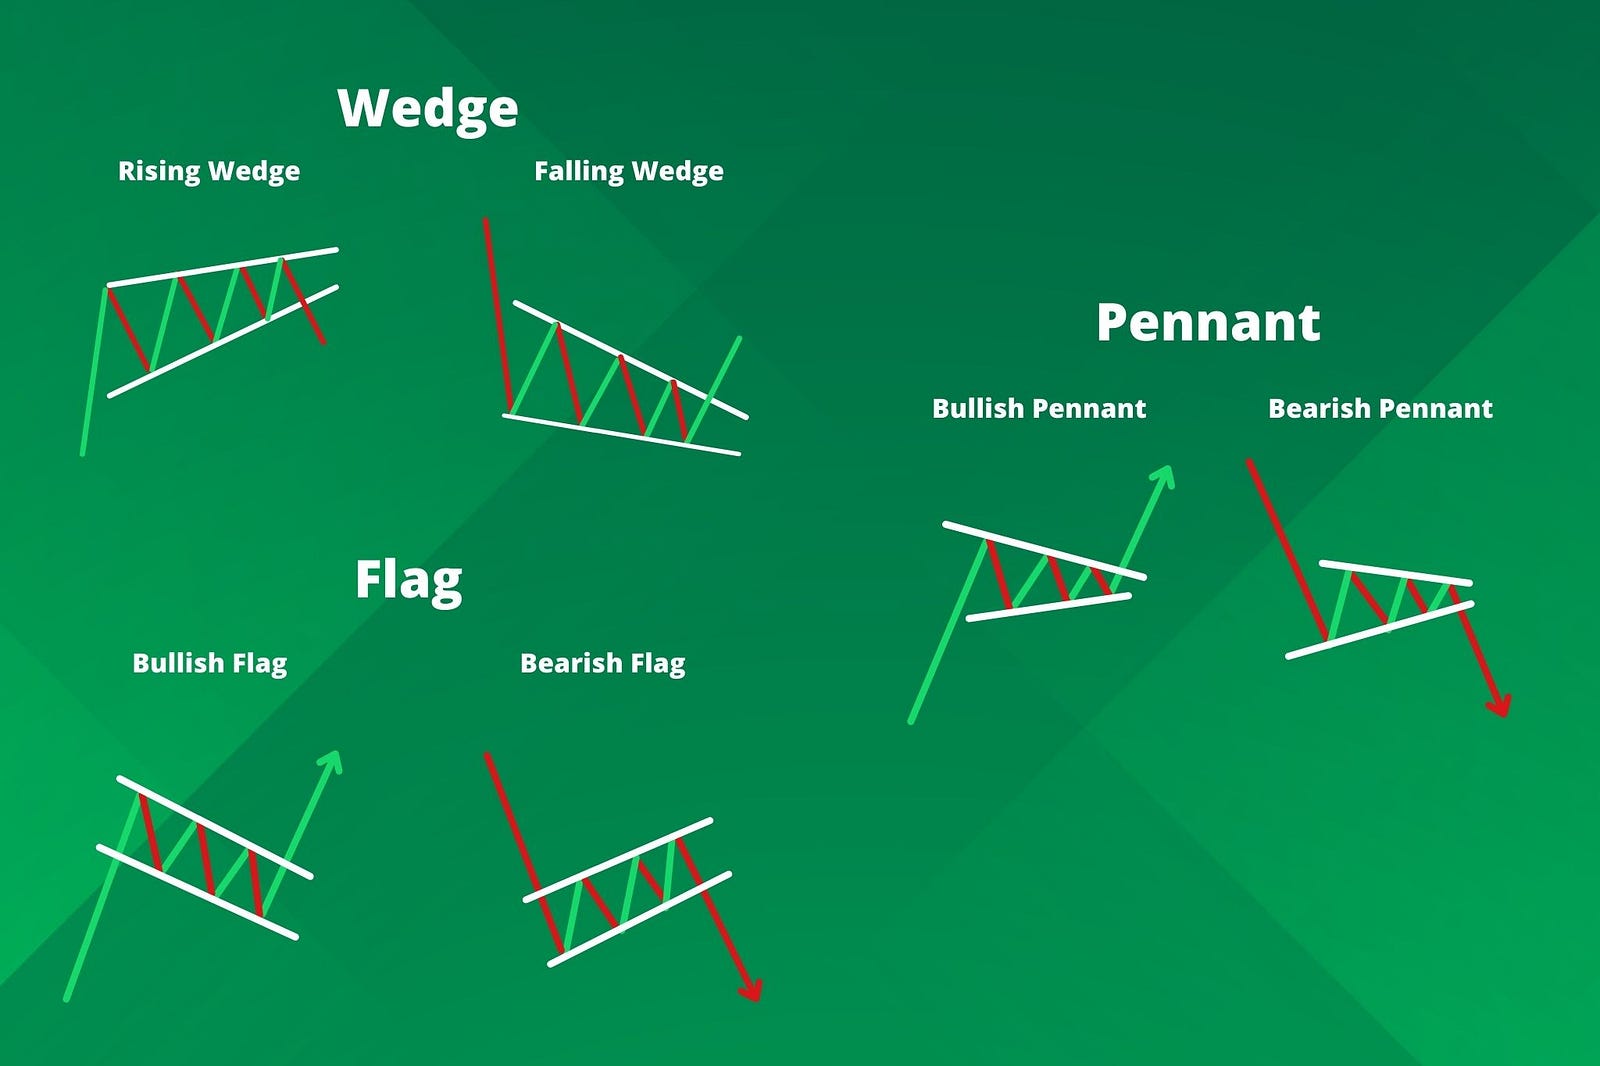
Wedge / Flag / Pennant สังเกตได้ว่าลักษณะนี้เป็นการที่กรอบราคาจะค่อย ๆ บีบอัดกันเข้ามาเรื่อย ๆ โดยที่กรอบราคาก็ค่อย ๆ ยกสูงขึ้นหรือต่ำลงเช่นกัน ซึ่งลักษณะนี้เป็นไปได้ทั้งสัญญาณของการกลับตัวและสัญญาณว่าจะไปต่อ ขึ้นอยู่กับว่าราคาจะหลุดกรอบไปในทิศทางไหน เมื่อเห็นสัญญาณเช่นนี้ นักลงทุนอาจพิจารณาขายทำกำไรหรือตัดขาดทุนออกไปส่วนหนึ่งเพื่อป้องกันความเสี่ยง
นอกจากนี้ ยังมี Graph Pattern อื่น ๆ อีกมากมายเลย แต่ถ้านักเทรดเข้าใจตัวอย่างที่ยกมานี้แล้ว การเรียนรู้รูปแบบอื่น ๆ ต่อก็ไม่ใช่เรื่องยากแล้วล่ะ!
==========
2.เข้าใจพื้นฐานของเหรียญ เสริมสร้างความมั่นใจ
เหรียญทุกเหรียญที่อยู่บน Bitkub ต่างถูกสร้างขึ้นโดยมีวัตถุประสงค์และมีคุณสมบัติแตกต่างกันออกไป ยกตัวอย่าง Bitcoin ที่ถูกสร้างขึ้นให้มีจำนวนจำกัดที่ 21 ล้านเหรียญเพื่อป้องกันผลกระทบจากภาวะเงินเฟ้อ หรือ Ethereum ที่เป็นเครือข่ายบล็อกเชนที่สามารถใช้ Smart contract โดยมีเหรียญ Ether (ETH) เป็นเหมือนค่าธรรมเนียมในการใช้งาน Smart contract และแอปพลิเคชันที่สร้างขึ้นบนเครือข่าย
เพราะฉะนั้น หากเรามีความเข้าใจในคุณสมบัติของเหรียญที่เราถือจะช่วยให้เรามีความมั่นใจในเหรียญนั้นมากขึ้น เหมือนกับการถือหุ้นของบริษัทเพราะเราเชื่อมั่นในตัวบริษัท ทีมบริหาร หรือมองเห็นโอกาสเติบโตทางธุรกิจของบริษัทนั้น ๆ นั่นเอง
หากคุณกำลังสงสัยว่าแต่ละเหรียญบน Bitkub มีคุณสมบัติอะไรที่น่าสนใจบ้าง สามารถมาอ่านต่อได้ที่บทความรวมเหรียญบน Bitkub นี่เลย หรือจะศึกษาจากบทความดี ๆ อีกมากมายได้ที่ Bitkub Academy
==========
3.หมั่นอดออม สะสมจากก้อนเล็กเป็นก้อนโต ด้วยกลยุทธ์ DCA
อีกหนึ่งกลยุทธ์ที่ได้รับความนิยมและน่านำมาใช้ที่สุดในภาวะเช่นนี้ ก็คือ DCA หรือ Dollar-Cost Averaging นั่นเอง โดยกลยุทธ์นี้สามารถอธิบายได้ง่าย ๆ ว่าเป็นการ “ลงทุนแบบสม่ำเสมอด้วยเงินทุนที่เท่า กันทุกเดือน” โดยไม่สนใจว่าราคาสินทรัพย์ที่ซื้อ ณ ตอนนั้นจะอยู่ที่เท่าไหร่
ยกตัวอย่าง กำหนดว่าจะซื้อ Bitcoin เป็นมูลค่า 3,000 บาท เท่ากันทุก ๆ เดือน โดยไม่สนใจราคาของ Bitcoin ที่เข้าซื้อในแต่ละเดือน
ถ้าเราเข้าใจและเชื่อมั่นในปัจจัยของเหรียญแล้ว เราก็สามารถทำ DCA ได้ แม้จะอยู่ในภาวะที่ตลาดซบเซาเช่นนี้ และการทำ DCA ในช่วงที่ราคาลง ยังทำให้นักลงทุนได้จำนวนเหรียญที่มากขึ้นอีกด้วย
สามารถศึกษาว่า DCA คืออะไรต่อได้ที่นี่เลย
==========
4.เปลี่ยนมาถือ Stablecoin เพื่อบริหารความเสี่ยง
เหรียญ Stablecoin ก็คือเหรียญที่มีมูลค่าคงที่ โดยบน Bitkub มีอยู่ 3 เหรียญ คือ USDT, USDC, และ DAI
วิธีที่เหรียญเหล่านี้ทำให้ตัวเองมีมูลค่าคงที่ได้ วิธีแรกคือการนำเหรียญไปผูกกับสินทรัพย์อื่น ซึ่ง USDT และ USDC ก็ได้นำเหรียญไปผูกไว้กับเงินดอลลาร์สหรัฐฯ ทำให้มูลค่าของเหรียญมีความใกล้เคียงกับเงินดอลลาร์แทบตลอดเวลา
อีกวิธีหนึ่งก็คือเหรียญ DAI ที่จัดเป็น Algorithmic Stablecoin โดย DAI สามารถรักษามูลค่าให้ใกล้เคียงกับเงินดอลลาร์ได้ผ่านการใช้ Smart contract ควบคุมอุปทานของเหรียญแทนที่จะนำเหรียญไปผูกกับเงินดอลลาร์
เนื่องจาก Stablecoin มีมูลค่าที่ค่อนข้างคงที่ การเปลี่ยนมาถือ Stablecoin ส่วนหนึ่งในช่วงที่ตลาดเกิดความผันผวน ก็เป็นวิธีช่วยบริหารความเสี่ยงให้กับพอร์ตการลงทุนที่น่าสนใจอีกหนึ่งวิธีนั่นเอง
==========
ส่งท้าย
สำหรับสภาวะตลาดเช่นนี้ วิธีบริหารความเสี่ยงที่ดีที่สุดก็คือการหมั่นติดตามข่าวสาร หาความรู้เกี่ยวกับการลงทุนหรือสินทรัพย์ที่สนใจลงทุนเสมอ รวมทั้งทำความเข้าใจว่าตลาดย่อมมีวัฏจักรขึ้นและลงสับเปลี่ยนกันไป
อ้างอิง Cointelegraph, Coindesk
— — — — -
ติดตามบทความ ข่าวสาร และความรู้ที่น่าสนใจในวงการคริปโตได้ที่ Bitkub Blog
เรียนรู้เรื่อง บิทคอยน์ (Bitcoin) และ Cryptocurrency ที่น่าสนใจก่อนเริ่มลงทุน
สมัครบัญชี Bitkub เพื่อ trade Cryptocurrency ได้แล้ววันนี้ คลิกเลย www.bitkub.com/signup
*สินทรัพย์ดิจิทัลมีความเสี่ยง โปรดศึกษาและลงทุนให้เหมาะสมกับระดับความเสี่ยงที่ยอมรับได้
**คริปโทเคอร์เรนซีมีความเสี่ยงสูง คุณอาจสูญเสียเงินลงทุนได้ทั้งจํานวน
***ผลตอบแทนของสินทรัพย์ดิจิทัลในอดีตหรือผลการดําเนินงานในอดีต มิได้เป็นสิ่งยืนยันถึงผลตอบแทนของสินทรัพย์ดิจิทัลหรือผลการดําเนินงานในอนาคต
==========
4 ways to manage risk: Adjusting strategies to fit market conditions
Amidst the uncertain global situation, investment markets have entered a downturn, and the cryptocurrency market is no exception. This is a cyclical pattern that occurs regularly in the market.
For investors in the cryptocurrency market, there are ways to manage risk and survive in various market conditions. Let’s take a look at 4 ways to manage risk and adjust strategies to fit the market!
==========
Practice observing Graph Patterns for market trend analysis.
Observing the movement of price graphs or Graph Patterns can be considered as a fundamental technique that technical traders must do. Graph Patterns not only help to analyze where the price will go next, but also can analyze whether the price will reverse or not. Traders can develop suitable strategies for every situation.
To be able to read Graph Patterns, we need to know how to find support and resistance levels first. Basically, we can find support and resistance levels from the lowest and highest price levels in a certain period of time. Then, we can draw a line from one lowest level to another, just like with the highest level. By doing this, we will have two lines that create a frame for the price. And we can use this frame to observe Graph Patterns.
Graph patterns can be divided into 2 types, which are 1) Reversal Pattern, a signal of a reversal, and 2) Continuation Pattern, a signal that the price will continue in the same direction. Examples that are often seen include:

Double Bottom / Double Top: This is a signal of a price reversal. An example is the Double Top, where the price rises to hit resistance then bounces back down twice (the graph resembles the letter M), indicating that the price may reverse back down. The Double Bottom is the opposite of the Double Top, where the price hits support twice in a row (the graph resembles the letter W), indicating that the price may reverse up.

Head and Shoulders / Inverse Head and Shoulders: This is a graph pattern that looks like a person’s head and shoulders. It is a signal that the current direction may end soon or a Reversal Pattern, such as the Head and Shoulders, which often occurs during an uptrend, indicating that the uptrend may end. The Inverse Head and Shoulders, on the other hand, which is the opposite of the Head and Shoulders, often occurs during a downtrend and is a signal that the downtrend may end.

Wedge / Flag / Pennant: This pattern is characterized by the price range gradually tightening, with the price also gradually rising or falling. This pattern can be a signal of a reversal or a signal that the price will continue, depending on which direction the price breaks out of the range. When investors see such a signal, they may consider selling to take profits or cut losses to manage risks.
In addition to this, there are many other Graph Patterns as well. However, if traders understand the example given here, learning other patterns shouldn’t be difficult!
==========
2.Understanding the basics of cryptocurrencies and building confidence
Every cryptocurrency on Bitkub is created with different objectives and characteristics. For example, Bitcoin was created with a limited supply of 21 million coins to prevent the impact of inflation, while Ethereum is a blockchain network that enables the use of smart contracts with its native coin, Ether (ETH), acting as a fee for the network and applications built on top of it.
Therefore, having an understanding of the characteristics of the coins you hold will help you gain more confidence in them, similar to holding stocks in a company because you have faith in the company, its management team, or see potential for business growth.
If you’re curious about the interesting characteristics of each coin on Bitkub, you can read more in the article on Bitkub Blog.
==========
3.Accumulate from small to large chunks using the DCA strategy
Another popular and effective strategy in situations like this is the Dollar-Cost Averaging (DCA). Simply put, this strategy is investing a fixed amount of money every month regardless of the price of the asset being purchased at that time.
For example, let’s say we decide to buy Bitcoin worth 3,000 baht every month without considering the price of Bitcoin at the time of purchase.
If we understand and trust the factors of the coin, we can still do DCA even in a market downturn. Doing DCA during a price dip can also result in a larger amount of coins for the investor.
You can learn more about what DCA is here.
==========
4.Switching to holding Stablecoins to manage risk
Stablecoins are cryptocurrencies with a stable value, and on Bitkub Exchnage, there are three types: USDT, USDC, and DAI.
One way these coins maintain their value is by being pegged to other assets. For example, USDT and USDC are pegged to the US dollar, which keeps their value relatively stable. Another way is through algorithmic methods which uses smart contracts to control its supply and demand to keep its value stable.
Since Stablecoins have a relatively stable value, switching to holding them can be a way to manage risk during market fluctuations. It can be an interesting way to diversify an investment portfolio.
==========
Conclusion
For a market situation like this, the best way to manage risk is to constantly follow the news, seek knowledge about investing or assets of interest, and understand that the market is always subject to ups and downs and constantly changing.
Reference: Cointelegraph, Coindesk
ที่มา:
Medium