
XRP Price Analysis: Can XRP Hold Its Key $1.30 Support?
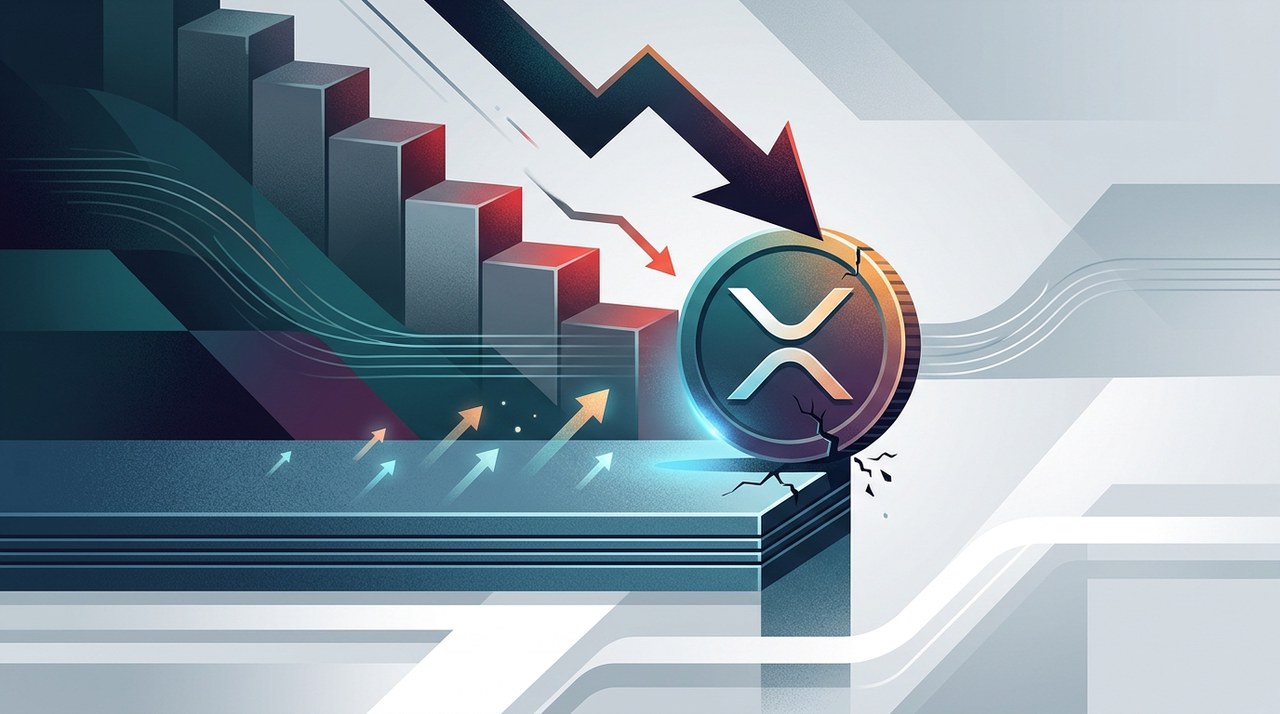
What Is Happening with XRPXRP+1.76% Right Now?
XRP has been drifting downward over recent trading sessions. The token has now slipped back into a key demand zone near $1.30.
This pullback gives up a good portion of the price gains made during September. Right now, sellers remain in the driver seat, creating a clear pattern of lower highs and lower lows.
Think of price action like a staircase. When prices consistently make lower steps on the way down, it shows strong selling momentum. However, XRP is now sitting near a floor where buyers previously stepped in with strong interest.
Note: Past performance of digital assets is not an indicator of future returns. You can track live market data anytime on bitkub.com/th/market/XRP.
The Daily Chart: Sellers Pressure the $1.24–$1.32 Zone
Looking at the daily timeframe, XRP ran into trouble when it attempted to bounce near $1.40. That recovery lost steam quickly.
Following that rejection, several red daily candles pushed the asset down into the highlighted $1.24–$1.32 demand area.
A demand zone is a price region where buyers historically enter the market in high numbers. This exact area sparked September's impressive price rally. While historical demand makes this level important, buyers have not yet produced a strong reaction this time around.
Potential Upside Scenario
For buyers to regain control, XRP first needs to stabilize within this demand area. A sustained move back above $1.32 would offer an initial signal that buying interest is returning.
If that recovery holds, XRP could open the path toward the $1.38–$1.42 resistance zone. This is the same region where the previous rebound stalled out.
Potential Downside Scenario
On the flip side, ongoing weakness through the lower boundary at $1.24 would break the support structure established in September.
If $1.24 fails to hold, it raises the risk of a deeper market correction. In that scenario, the next major daily support level sits further down around $1.11–$1.17.
The 4-Hour Chart: Inside the Descending Channel
Zooming in on the 4-hour chart gives us a clearer picture of short-term price movements.
XRP continues to trade inside a descending channel. You can imagine this channel as a downward-sloping hallway with a defined ceiling and floor.
Recent attempts to bounce have repeatedly failed before reaching the channel's midpoint. The latest drop has now pushed XRP into the $1.27–$1.31 support region near the channel's bottom boundary.
Steps Required for a Short-Term Rebound
- First, buyers must hold $1.27 and push the price back above $1.31.
- Next, XRP needs to break through the channel's descending midpoint around $1.32–$1.33.
- Clearance above the recent swing highs at $1.34–$1.35 would be required to build further momentum.
- A stronger push could then target the upper boundary of the channel near $1.39–$1.40.
What Happens If Support Fails?
If buyers fail to defend the $1.27 mark, XRP could revisit earlier wick lows around $1.25.
A breakdown below both $1.25 and the channel's lower boundary would suggest that selling pressure is speeding up.
Until XRP breaks out of its pattern of lower highs, any temporary price bounce remains vulnerable to renewed selling.
Summary of Important Price Levels
- Major Demand Zone (Daily): $1.24 – $1.32
- Immediate Support (4-Hour): $1.27 – $1.31
- Lower Support Targets: $1.25, then $1.11 – $1.17
- Key Resistance Levels: $1.31, $1.32–$1.33, $1.34–$1.35, and $1.38–$1.42
Crypto markets can move quickly in response to shifting market conditions. Watching how price reacts at these key technical zones helps provide clarity on market direction.
Latest blog posts



Giancarlo and Draper Dragon Back Spout's $2M Round
Chris Giancarlo and Draper Dragon back Spout, a Solana protocol offering zero-interest loans on tokenized stocks.
|
Nikkei Drops 2% as US Tech Selloff and Oil Spike Hit Japan
Japan's Nikkei 225 index dropped 2% on Monday morning, wiping out $150 billion in market value amid US tech weakness and rising oil costs.
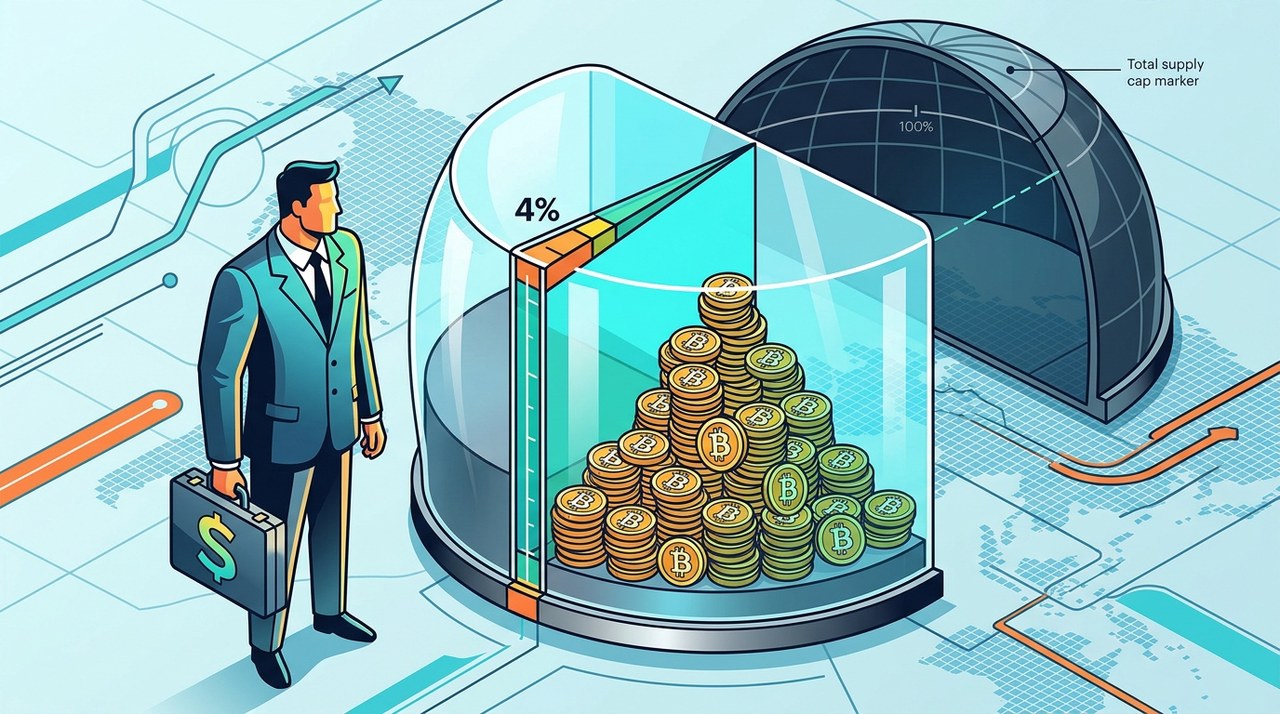

Strategy Holds Over 4% of Total Bitcoin Supply
Strategy's Bitcoin treasury reaches 848,250 BTC worth $69.6 billion, representing over 4% of all Bitcoin that will ever exist.
|