
XRP Ledger Sees 25,000 Returning Accounts as Activity Jumps

What is Happening on the XRPXRP-2.32% Ledger?
If you follow the XRP Ledger, you might have noticed a sudden burst of energy on the network recently.
On October 21, on-chain data from XRPScan showed a total of 25.7K active accounts interacting with the network. That represents a single-day increase of roughly 12%.
To put that into context, the 30-day average for active accounts sits around 18.6K. Seeing activity jump well above normal baseline levels usually signals that something interesting is happening under the hood.
Are These Brand-New Crypto Users or Old Friends Returning?
When network activity surges, the first big question is always simple: Where are these people coming from?
Looking deeper into the data gives us a clear answer. Out of those 25.7K active accounts, only 4.5K were newly created wallets.
While new account creation did jump by 35.6%, the math tells us that over 21,000 of the active wallets were existing addresses waking up after a period of quiet.
Think of it like a popular retail store. A surge in foot traffic is great, but in this case, most shoppers are existing loyalty card members returning rather than new customers walking through the door for the first time.
Even though it is not a massive influx of fresh users, seeing existing holders reactivate their wallets is generally a healthy indicator of community engagement.
A Closer Look at Key On-Chain Metrics
It is not just account numbers going up. Several other core network metrics showed notable increases on the same day:
- Total Transactions: Climbed 55.9% to reach 3.5 million.
- Successful Transactions: Increased by 67.8% to hit 2.9 million.
- Transactions Per Ledger: Rose 61.5% to 179.34, showing the network was handling a significantly higher load.
- XRP Burned as Fees: Rose 20% to reach 747.6 XRP.
The increase in burned XRP is worth taking note of. On the XRP Ledger, every transaction burns a tiny amount of XRP to pay for network fees. When user activity goes up, more XRP is permanently destroyed, slightly reducing the total circulating supply.
The Mixed Signals: Not Every Metric Was Positive
To keep an accurate and balanced view of the market, it is essential to look at the metrics that went down as well.
Despite higher account interactions and transaction counts, actual payment transfers told a different story:
- Total Payments: Dropped 4.4% to 741.9K.
- Payment Volume: Plummeted 49.6% down to 350.9M XRP.
- Active Users Metric: A separate measure of distinct user actions fell 50% to 85.2K.
What does this contrast mean? It suggests that the spike in ledger activity was not driven by massive fund transfers or large institutional payments.
Instead, the activity likely came from smaller micro-transactions, automated trading bots, or custom token interactions on the ledger.
It is also worth remembering that the XRP Ledger once hit an all-time high of 106K active accounts. Current levels, while recovering, remain well below historical peaks.
What Does the Price Chart Say for XRP?
Network data is valuable, but traders always want to know how the token price is behaving.
XRP has been trading around $1.33, staying within a relatively tight daily price range between $1.32 and $1.37.
Before analyzing price technicals, please keep in mind: Past performance of digital assets is not a guarantee of future returns. You can check real-time market data directly at bitkub.com/th/market/XRP.
Here are the key technical levels and indicators currently surrounding XRP:
- Resistance Zone ($1.37 - $1.40): The price sits just beneath a key long-term moving average that has consistently capped upward movement.
- Support Zone ($1.25): This acts as the floor where buyers stepped in to bounce the price earlier this month.
- Relative Strength Index (RSI): Sits below the 50 midpoint line, signaling weak buying momentum.
- Trading Volume: Remains relatively low compared to earlier periods of high volatility.
Potential Market Scenarios to Watch
Because network metrics and price movements do not always align instantly, investors should monitor several potential market outcomes based on specific technical conditions:
1. Bullish Breakout Scenario
If overall network activity remains elevated over the coming days and trading volume increases, buyers might attempt a push above resistance. A decisive move above $1.40 with strong volume could confirm that price is following on-chain growth, opening the door toward higher targets.
2. Bearish Pullback Scenario
If returning user activity proves to be short-lived or if broader crypto market weakness persists, selling pressure could increase. A breakdown below the $1.25 support level would weaken the current technical outlook and could push prices toward lower support regions.
3. Sideways Consolidation Scenario
If network usage stays higher while market volume remains flat, XRP may continue to consolidate neutrally between the $1.25 support and $1.37 resistance boundaries while waiting for broader market direction.
For now, the XRP Ledger is clearly seeing more traffic, but the price remains in a watchful pause.
Latest blog posts


SoFi Launches Tokenized Bank Deposit Offering 4.4% Yield
SoFi introduced SoFi Earn (SOFIE), a consumer tokenized deposit offering 4.40% APY with FDIC insurance that easily converts into its stablecoin.
|
Dune Launches Real-Time Data Feeds for Onchain Markets
Dune has launched real-time market feeds covering trade data from over 200 onchain venues across 12 blockchain networks as tokenized assets grow.
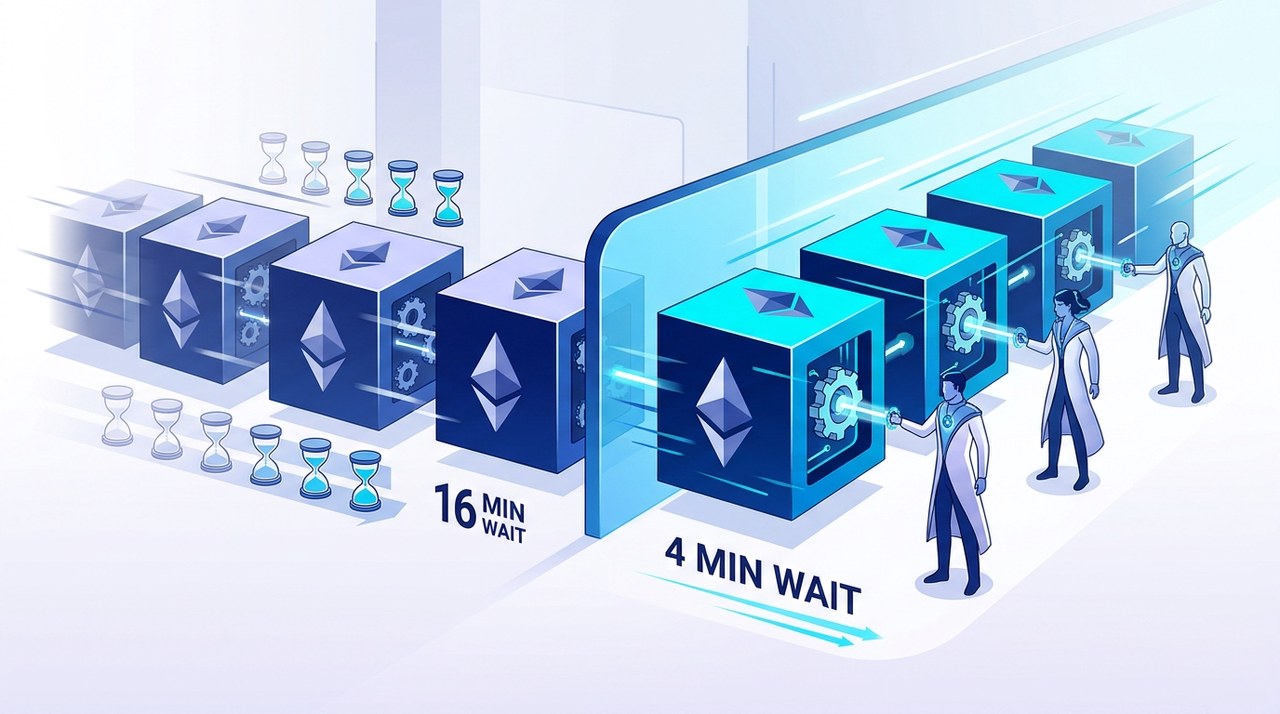

Ethereum Plan Targets 4-Minute Transaction Finality
Ethereum researchers have proposed a plan to reduce transaction finality time from 16 minutes to four minutes, potentially lowering cross-chain transfer costs.
|