
SAND Price Analysis: Can Sandbox Reach $0.10 by 2026?

Metaverse tokens are back in the spotlight, and The SandboxSAND+11.40% is catching plenty of attention. After months of downward pressure, SAND surged over 170% from its lower levels before undergoing a market pullback.
With the price currently hovering around $0.062 to $0.063, traders are watching closely to see if this recovery can turn into a lasting uptrend.
Past performance of digital assets is not an indicator or guarantee of future returns. You can track real-time market data anytime at bitkub.com/th/market/SAND.
What Is Happening with The Sandbox (SAND) Right Now?
To understand where SAND might head next, let us look at its recent price journey. Back in September, the token hit a local low around $0.035.
A sharp rally in October pushed prices up to $0.080, followed by a pullback to current levels near $0.063. Now, the immediate hurdle sits around $0.069.
Trading activity has picked up significantly. SAND's 24-hour trading volume surged by nearly 560%, reaching roughly $225 million. This surge indicates that buyers and sellers are actively engaged in the market once again.
Key technical indicators show an interesting setup:
- Relative Strength Index (RSI): The RSI bounced back from average levels, signaling that bullish momentum is rebuilding, though it still awaits firmer confirmation.
- On-Balance Volume (OBV): OBV spiked sharply, showing higher trading activity. However, it does not yet confirm steady spot market buying.
Derivatives and Market Sentiment: Looking Behind the Scenes
While price charts show movement, derivative market data provides deeper insights into how traders are positioning themselves.
Open Interest Is Rising
Open Interest (OI) measures the total number of outstanding derivative contracts. SAND's OI jumped from local lows around 23.40 million to 45.65 million. This means more traders are entering futures positions.
Negative Funding Rates & Short Squeeze Potential
The funding rate turned heavily negative to -0.8900. In crypto markets, a negative funding rate means short sellers (traders betting on price drops) are paying long traders to keep their positions open.
When heavy short positions combine with high Open Interest, it opens the door for a potential short squeeze. If the price moves up unexpectedly, short traders may be forced to buy back their positions, pushing prices up rapidly.
Cumulative Volume Delta (CVD) Cautions Traders
Despite short squeeze potential, Cumulative Volume Delta (CVD) signals caution:
- Spot CVD: Dropped to -55.66 million after a brief October spike, meaning aggressive spot selling outweighed aggressive spot buying.
- Futures CVD: Fell to -3.44 billion, showing persistent net selling in derivative markets.
- Liquidations: Recent price swings triggered noticeable liquidation spikes during both the rally and the pullback.
Key SAND Price Levels to Monitor
Trading near $0.062, specific technical support and resistance zones will determine SAND's next major trend.
- Immediate Resistance: $0.064 to $0.065
- Major Resistance Zone: $0.067 to $0.069
- Higher Resistance Targets: $0.077 to $0.080
- Key Immediate Support: $0.060 to $0.061
- Lower Support Zone: $0.057 to $0.058
- Deeper Support Targets: $0.053 to $0.055
Potential Market Scenarios: Bullish vs. Bearish
Market conditions can evolve quickly. Here is how both scenarios could unfold.
The Bullish Scenario
If buyers push SAND above the major resistance zone between $0.067 and $0.069 alongside improving spot CVD, momentum could strengthen.
In that situation, SAND could head toward $0.077 to $0.080, with higher targets around $0.09169. However, reaching these levels requires sustained spot demand rather than brief speculative spikes.
The Bearish Scenario
If SAND fails to break $0.069 and falls below the $0.060 support level, renewed selling pressure could drive prices down to $0.057 to $0.058.
Continued downward momentum could expose lower support between $0.053 and $0.055.
Can The Sandbox (SAND) Reach $0.10 by 2026?
Looking ahead toward 2026, reaching $0.10 is an upside possibility, but it depends on several key market conditions:
- Broader Market Conditions: Overall crypto market sentiment must remain strong and supportive.
- Metaverse Sector Interest: Renewed demand and user engagement across metaverse projects.
- Ecosystem Activity: Growth in active users and developer activity within The Sandbox ecosystem.
- Organic Spot Demand: Steady accumulation from spot buyers rather than temporary futures leverage.
Ultimately, while a rally toward $0.10 is possible under favorable conditions, it should be treated as a potential scenario rather than a guaranteed outcome. Investors should monitor both spot volume and broader market trends closely.
Latest blog posts
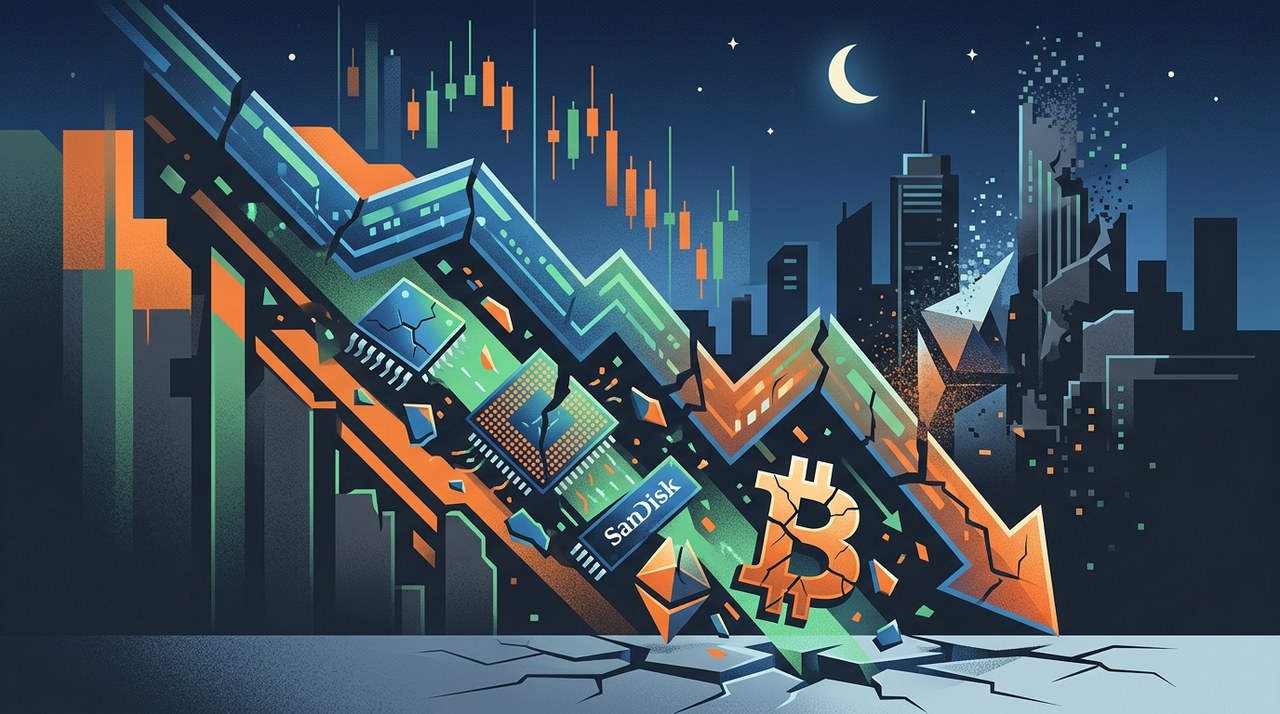


Weekend Flash Crash Spooks Crypto and AI Stock Traders
A sudden weekend flash crash impacted Bitcoin, Ethereum, and AI stock perpetuals, leaving traders debating whether a Black Monday crash is looming.
|
VeChain AI Pivot: Can VET Break Above $0.010 Resistance?
VeChain aims to serve as a trust layer for AI agents while VET tests key technical resistance near $0.010 amid broader AI market expansion.

 +2
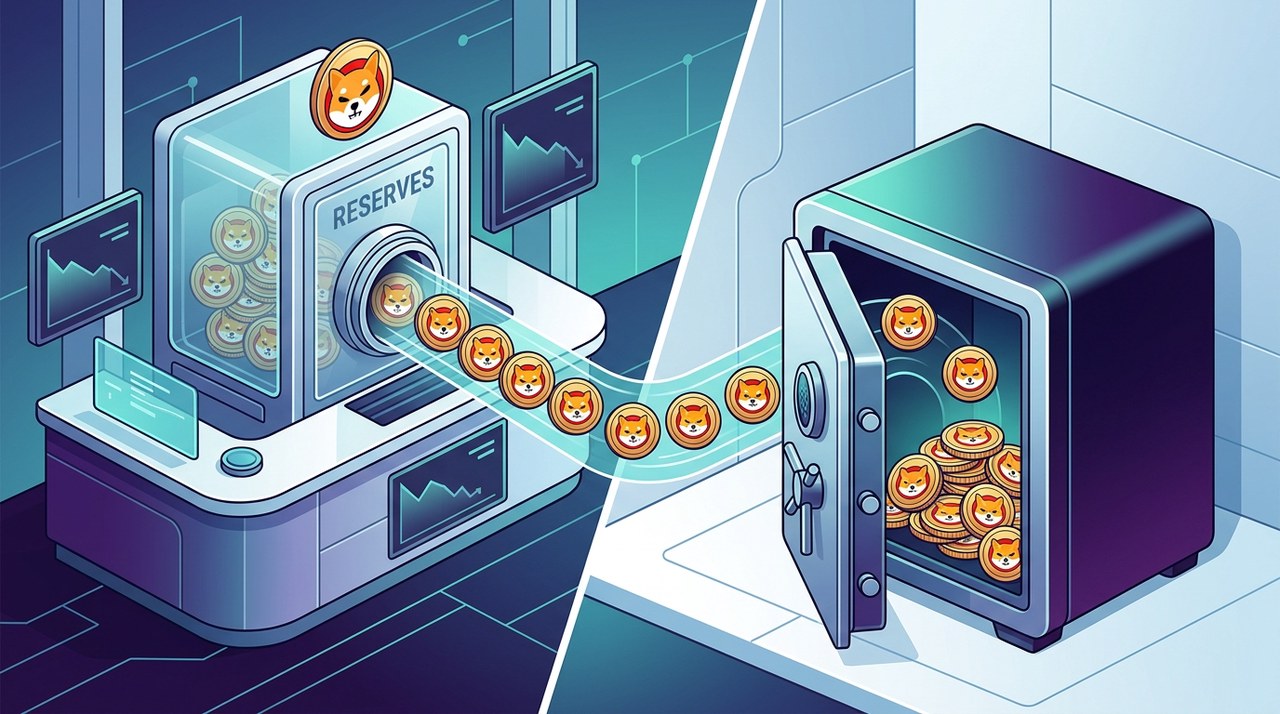
Shiba Inu Supply Drops as Reserves Eye 86 Trillion
Shiba Inu exchange reserves are shrinking toward 86 trillion tokens as negative netflows signal fading sell pressure across exchanges.
|