

Blockchain Revenues Fall 30% as New Growth Engine Emerges

Overview: A Shift in Global Blockchain Revenues
Global blockchain revenues are taking a step back this year. Total annual revenues are projected to hit $100 billion in 2026. This marks a 30% drop from the roughly $140 billion recorded in 2025.
This overall pullback closely mirrors the average price movement of BitcoinBTC-1.78% over the same period, according to a recent industry report by 1KX. When market activity cools down, overall fee collection tends to slow down with it.
Even with lower totals, overall user behavior remains consistent. Onchain and offchain user-paid fees still generated between 50% and 60% of all blockchain revenues in 2026. The remainder came from alternative revenue streams, such as treasury yields and service fees.
Please note that past performance of digital assets or past operational results is not a guarantee of future digital asset returns or operational results.
Decentralized Finance Keeps Its Dominant Crown
For the fourth year in a row, the Decentralized Finance (DeFi) and broader finance sector brought in the largest share of revenue. In 2026, DeFi generated $65 billion. That accounts for roughly two-thirds of all blockchain revenue globally.
This represents a major shift over time. Back in 2022, when total industry revenues hit $82 billion, DeFi claimed a 52% share. Today, that share has expanded significantly, fueled largely by offchain financial fees.
Where Did the DeFi Revenue Come From?
The 1KX report breaks down the $65 billion DeFi and finance category into several specific business models:
- Centralized Exchanges & Derivatives: Generated 42% of the category's total revenue.
- Stablecoin Reserve Income & Yields: Made up 29% of sector revenue.
- Onchain User-Paid Fees: Accounted for 13% of the total.
- Asset Management & ETF Fees: Represented 7% of revenues.
- Prediction Markets: Contributed 6% to the finance category.
Infrastructure Revenue Reaches Multi-Year Lows
While finance sector revenues stayed strong, core blockchain infrastructure revenues dropped to $22 billion in 2026. This is the lowest level seen for base-layer infrastructure since 2020.
In fact, actual network transaction fees paid directly by users now make up less than 3% of total blockchain industry revenues. The remaining non-finance sectors brought in $12 billion overall, led primarily by consumer applications at 9%.
Institutional Adoption and Economic Use Cases Rise
While overall industry revenues shrank, institutional adoption and real-world economic use cases bucked the trend. Revenues tied to real-world economic activity grew to represent 30% of total blockchain revenues in 2026.
In fact, economic revenue surpassed base infrastructure revenue during the third quarter of 2026 for the first time in history. During the first half of 2026 alone, economic adoption revenues jumped by $2.9 billion compared to the previous year.
Key Drivers of Economic Revenue Growth
A major portion of this growth came from a $1.6 billion surge in utility sector fees. Here is how that breakdown looked:
- Prediction Markets: Added $1.4 billion in new revenue, expanding from near zero last year toward an estimated $4 billion total in 2026.
- Payment Solutions: Generated $200 million across credit cards, trade finance, and commercial payment rails.
- RWA Tokenization: Brought in $1.1 billion from tokenization, trading, and lending fees.
- Stablecoin Reserve Income: Rose by $250 million, remaining the largest single component of economic revenue since the Federal Reserve began hiking interest rates in 2022.
Data from Boston Consulting Group shows that businesses were involved in roughly 60% of all stablecoin transfers in 2025. Although total stablecoin supply growth stalled recently, actual payment transaction volumes reached all-time highs.
Real-World Assets (RWAs) Take Center Stage
Trading real-world assets on blockchain networks gained major momentum in 2026. RWA platforms generated an estimated $1 billion in trading fees during the first half of the year alone, with an average fee rate of 7 basis points (0.07%).
RWAs accounted for 18% of all perpetual futures volume in the third quarter. Tokenized stocks led the way, capturing 55% of all RWA perpetual volume and overtaking gold, which was the previous year's leader. Oil led among commodity-backed tokens, while pre-IPO equity tokens—led by SpaceX—emerged as a popular new asset class.
Why RWA Trading Outperformed Crypto Prices
Why did RWA trading thrive while crypto prices faced downward pressure? Industry leaders point out that real-world assets depend on entirely different economic drivers than standard cryptocurrencies.
Al Qureshi, CEO and co-founder of Black Lake Digital Markets, explained that RWA volume is closely tied to standard financial metrics like asset yield.
"RWA trading volumes are tied to real assets that, in many cases, are driven by yield. Cryptocurrency prices are, in fact, expressions of currency views on default risk, inflation, and novelty. This orthogonality works as long as things are relatively stable."
Qureshi compared the relationship between RWAs and native crypto assets to the relationship between U.S. Treasury bonds and the U.S. dollar. Both move independently until major financial stress forces their performance to align.
Himanshu Sahay, co-founder and chief revenue officer at Arch Lending, added that real-world assets offer investors diversification when crypto markets slump.
"The next thing to watch is whether that activity carries over into lending. When people can borrow against these assets as well as trade them, they become far more useful."
Robinhood Chain and Stock Tokenization
The rapid expansion of RWAs is visible on consumer-facing platforms. Tokenized stock trading volume on Robinhood Chain surpassed $13 billion in the third quarter of 2026. Remarkably, more than 70% of those trades occurred outside normal U.S. stock exchange operating hours.
Across all blockchain networks combined, total spot trading volume for tokenized real-world assets reached approximately $50 billion. The broader tokenized RWA market has now grown to $46.7 billion—a 17.4-fold increase over three years—with EthereumETH-0.29% hosting nearly half of the market.
Challenges Facing Tokenized Credit Markets
Despite rapid growth in stock and commodity tokens, other areas like tokenized credit still face growth hurdles.
Collin Sellers, vice president of solutions at Nuva Labs, highlighted that limited capital access and poor connection to traditional markets slow down progress.
"While credit portfolios can be represented onchain, they often remain difficult to trade, finance or use as collateral beyond the initial investment."
Sellers emphasized that tokenized credit needs greater 'composability'—meaning these assets must interact easily with secondary lending pools and yield strategies. To build long-term liquidity, the industry needs reliable valuation models, clear risk data, and active financial backers.
Looking Ahead to 2027: Is a Recovery on the Horizon?
Looking forward, analysts expect institutional adoption and real-world economic integrations to pave the way for a revenue rebound in 2027.
Key drivers like 24/7 global equity trading, expanded RWA tokenization, institutional stablecoin payment infrastructure, and plans like Nasdaq's proposed 23-hour trading schedule could move blockchain technology from early adoption into mainstream finance.
If institutional adoption accelerates alongside clear regulatory rules, industry revenues could return toward previous highs. However, if macroeconomic conditions worsen or regulatory approvals stall, revenue recovery could take longer than anticipated.
Latest blog posts

Ledger CTO Warns of Potential Quantum Threats to Bitcoin
Ledger CTO Charles Guillemet recently highlighted two cryptographic studies exploring theoretical long-term risks to Bitcoin's underlying math.
|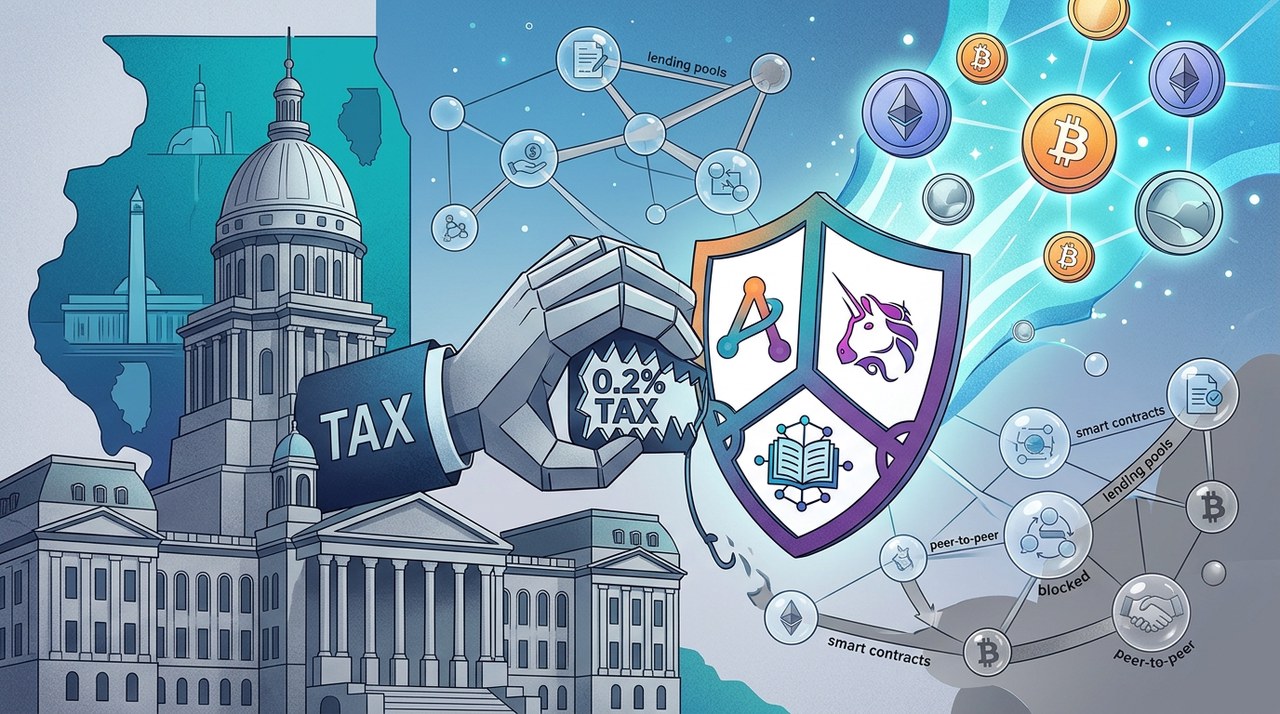

Illinois Crypto Tax Plan Sparks Major DeFi Ban Warning
Venture giant a16z, Uniswap Labs, and the DeFi Education Fund warn that Illinois' proposed tax rules could effectively ban decentralized finance.
|
Intel Stock Drops 30% as Weak Forecast Shadows AI Growth
Intel shares suffered their worst drop in 50 years after issuing a weak Q4 forecast, despite strong Q3 earnings and rising AI processor demand.