

S&P Global Raises 2026 Outlook After Strong Q3 Growth
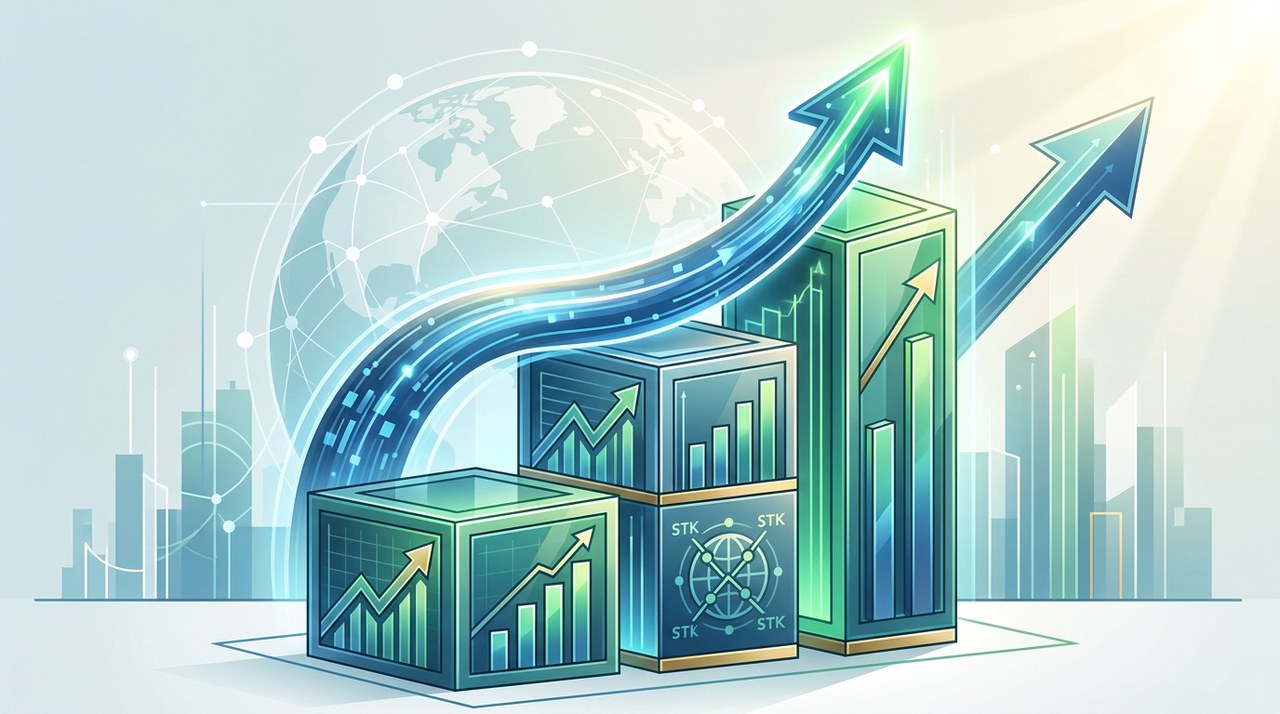
S&P Global Delivers Strong Q3 Financial Results
Financial data titan S&P Global (NYSE: SPGI) recently reported its third-quarter 2026 financial results. The company posted revenue of $3.68 billion for the quarter.
This top-line revenue figure represents a solid 7% increase compared to the exact same period last year. It highlights continued demand for data services across global capital markets.
In addition to revenue growth, S&P Global saw its adjusted earnings per share (EPS) rise 9% year over year to $4.58. This demonstrated strong operational efficiency and cost management.
Thanks to these positive quarterly results, executive leadership officially raised the company's full-year revenue and adjusted earnings guidance. Upgrading full-year guidance signals that management expects strong business momentum to continue through the rest of the fiscal year.
Segment Breakdown: Indices Lead the Expansion
Not all business units move at the same speed. During this third quarter, the Indices division served as the standout growth engine for S&P Global.
The Indices segment generated $554 million in quarterly revenue. That marks an impressive 20% jump compared to the same period in the previous year.
Why did the Indices business perform so exceptionally well? This division earns recurring fees when asset managers create exchange-traded funds (ETFs) or index funds tied to S&P benchmark indicators like the S&P 500 and Dow Jones Industrial Average. As trading activity and asset inflows increase, index licensing fees expand alongside them.
S&P Global also reported revenue growth in its Ratings segment. The Ratings business generates fees whenever corporations or government entities issue new bond debt and require credit evaluations.
What Does S&P Global Actually Do?
If you are new to tracking financial institutions, you might wonder why S&P Global plays such an important role in the global economy.
Think of S&P Global as the primary scorekeeper and referee of international finance. When major corporations want to borrow money, S&P evaluates their financial health. When equity investors want to gauge market performance, they look at S&P stock market indices.
Here are the primary business lines that power S&P Global's revenue model:
- Credit Ratings: Evaluating the creditworthiness and default risk of corporate and government debt issuers.
- Market Intelligence: Providing institutional investors with desktop analytics, research, and data feeds.
- Indices: Licensing world-renowned market benchmark indices to investment product creators.
- Commodity Insights: Delivering price benchmarks and market data for global energy and metals markets.
- Mobility: Offering automotive industry insights, supply chain tracking, and vehicle market analytics.
Bridging Wall Street Data and the Crypto Ecosystem
You might be wondering how traditional financial market data connects to digital assets and cryptocurrency markets.
In recent years, major benchmark providers like S&P Global have expanded into digital asset data. Institutional investors require verified, reliable market data before deploying capital into digital asset products.
S&P Global launched digital asset indices designed to track major cryptocurrencies such as BitcoinBTC-0.09% and EthereumETH+0.37%. These index tools allow traditional fund managers to benchmark digital portfolios using familiar corporate reporting standards.
As tokenization of real-world assets (RWAs) continues to gain traction, high-quality data providers play a critical bridging role between traditional financial markets and decentralized technology platforms.
Understanding Key Financial Metrics
Financial reporting terms can sound technical at first glance. Let's simplify the main concepts used in earnings updates like this one.
Revenue: This measures the total cash brought into a business through its operations before deducting operating costs and taxes. S&P Global earned $3.68 billion in quarterly revenue.
Adjusted Earnings Per Share (EPS): EPS shows how much net profit a company generates for each share of common stock. The term adjusted means the company removed one-time accounting items to reveal underlying operating efficiency. SPGI reached $4.58 per share.
Year-Over-Year (YoY): This calculation compares current performance directly to the exact same calendar period from the prior year. It helps investors eliminate seasonal noise.
Guidance: This is an official forward-looking estimation released by corporate executives regarding expected future financial performance.
Market Scenario Analysis and Risk Considerations
While S&P Global operates a recurring subscription revenue model, market conditions will influence its future trajectory. Investors can evaluate potential scenarios and risks.
Positive Growth Scenarios:
- Continued ETF Market Inflows: Higher demand for index-linked investment products can increase market licensing fees.
- Monetary Policy Easing: Lower global interest rates could stimulate corporate debt issuance, driving demand for new credit ratings.
- Institutional Crypto Market Growth: Broader institutional adoption of digital assets can expand licensing for crypto indices and data tools.
Risk Factors to Monitor:
- Equity Market Downturns: Sustained bear markets reduce total index assets under management, which can lower asset-based fee collections.
- Macroeconomic Stagnation: Economic slowdowns may lead corporations to delay debt financing, reducing credit rating volume.
- Regulatory Changes: Shifts in financial data privacy laws or licensing rules could increase operational costs.
Past performance of financial assets or corporate securities does not guarantee future results. Investors should review underlying business fundamentals and risk factors when evaluating market updates.
Final Wrap-Up
S&P Global delivered strong third-quarter performance, highlighted by $3.68 billion in revenue and an upward revision to its full-year guidance.
Driven by 20% growth in its Indices division and firm demand for Ratings, the firm demonstrates the strength of its diversified market data model.
As traditional capital markets and digital asset ecosystems continue to converge, reliable data benchmark providers remain vital infrastructure components for global finance.
Latest blog posts

Nvidia Stock Premarket Rises After $3B Meta Investment
Nvidia stock rose 2% in premarket trading following news of a $3 billion investment in Meta's equity offering to power next-gen AI systems.
 +1
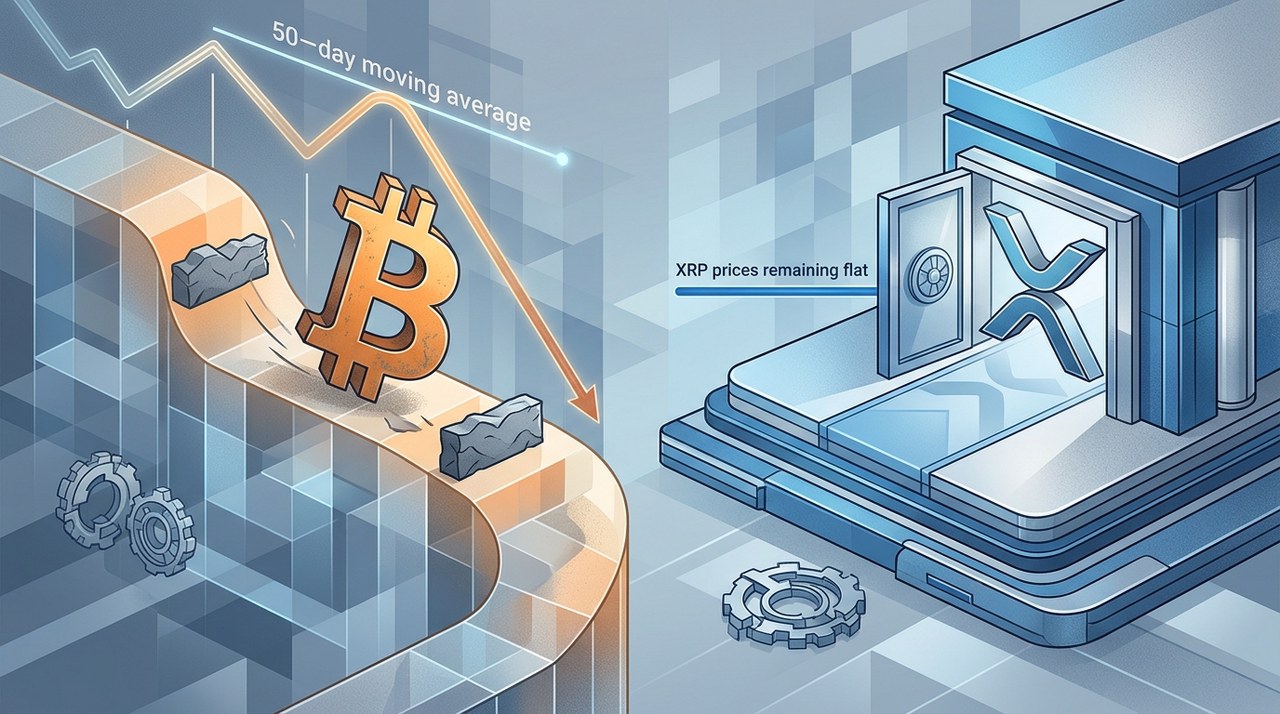
Bitcoin Struggles as Ripple Bank Approval Fails to Lift XRP
Bitcoin trades under pressure while Ripple secures a major U.S. banking victory that surprisingly fails to boost XRP prices.
|
Asterium Adds Apple Pay for Visa and Mastercard Holders
Asterium cardholders in Uzbekistan can now connect their Visa and Mastercard cards to Apple Pay for fast and secure everyday payments.