
Ripple Price Analysis: Will XRP Hold Support Above $1.00?
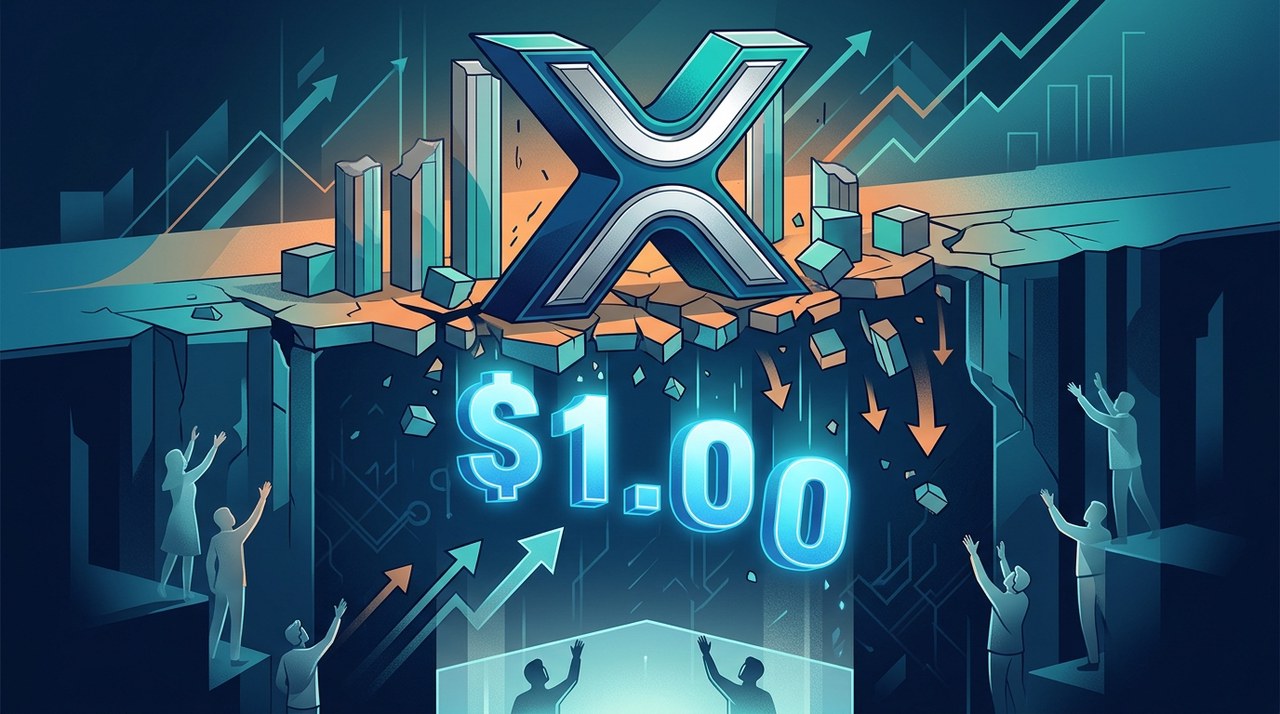
RippleXRP-0.49%'s native token, XRP, has experienced a sharp price pullback after failing to hold a key support zone. The price recently fell toward $1.16 as sellers retained control across both short-term and long-term timeframes. Traders are now watching lower demand areas closely to see if buyers step back in.
The Daily Chart: Looking at the Bigger Picture
On the daily chart, XRP continues to show a clear downward pattern. The token recently tried to recover into the $1.30–$1.34 supply zone. However, sellers quickly rejected that push, causing a breakdown below the key $1.24–$1.28 support area.
Following that breakdown, several red daily candles carried the price down toward $1.16. Buying response near this level has remained limited so far.
If selling pressure continues, the next major demand zone sits around $1.09–$1.14. This range marks the starting point of August's strong price advance. Should buyers step in around this area, XRP could experience a brief relief bounce. However, sustained recovery would require stronger buying volume than recent candles have shown.
On the downside, if the price experiences a sustained breakdown below $1.09, XRP could test the broader $0.99–$1.03 support zone near its August lows. Conversely, if buyers regain control and push the price back above $1.24–$1.28, immediate downside pressure could ease, though the $1.30–$1.34 supply zone remains a major obstacle.
Past performance of digital assets is not an indication of future performance. You can check real-time technical data on Bitkub Market.
The 4-Hour Chart: Short-Term Patterns and Channel Boundaries
The four-hour chart highlights a failed breakout attempt above the upper boundary of a descending channel. XRP briefly advanced into the $1.30–$1.34 supply zone before reversing sharply downward. It fell back inside the channel and broke below its consolidation base near $1.25.
This ongoing sequence of lower highs and lower lows points to active bearish momentum. The price is currently consolidating in a narrow range around $1.16, but this pause has not yet confirmed a clear shift toward a bullish structure.
The immediate level to watch on the downside is the $1.15 low, followed by the $1.09–$1.14 demand zone. Interestingly, the descending channel's lower boundary currently passes through approximately $1.12, providing additional technical alignment within that support area.
Key Levels for Potential Recovery Scenarios
For XRP to build momentum for a sustained recovery, buyers need to clear specific resistance levels step by step:
- First Resistance ($1.18–$1.20): Overcoming recent lower highs in this area is required to open the path for a bounce.
- Secondary Goal ($1.24–$1.28): Acceptance above this former support area—which overlaps with the descending channel's upper boundary—could ease downside pressure.
- Major Barrier ($1.30–$1.34): XRP must reclaim this strong supply zone to signal a broader structural market recovery.
Until XRP successfully reclaims these overhead technical levels, short-term price rebounds remain vulnerable to renewed selling activity. Cryptocurrency markets remain volatile, so tracking risk factors across both bullish and bearish scenarios is essential.
Latest blog posts

Bitcoin Faces Key Support Test After Rejection Near $81K
Bitcoin is consolidating near $75.9K after a sharp rejection at $81K, placing key daily and 4-hour technical levels under close observation.
|

JPMorgan Stock Drops as Epstein Inquiry Resurfaces
JPMorgan Chase stock fell after news of a new Senate inquiry into its Jeffrey Epstein ties, highlighting key differences with decentralized Bitcoin.
|

Evernorth Data Reveals How RLUSD Drives XRP Ledger Trading
A report by Nasdaq-listed Evernorth shows that Ripple's RLUSD stablecoin isn't replacing XRP, with 92% of swaps trading against XRP.
|