
Bitcoin Faces Key Support Test After Rejection Near $81K
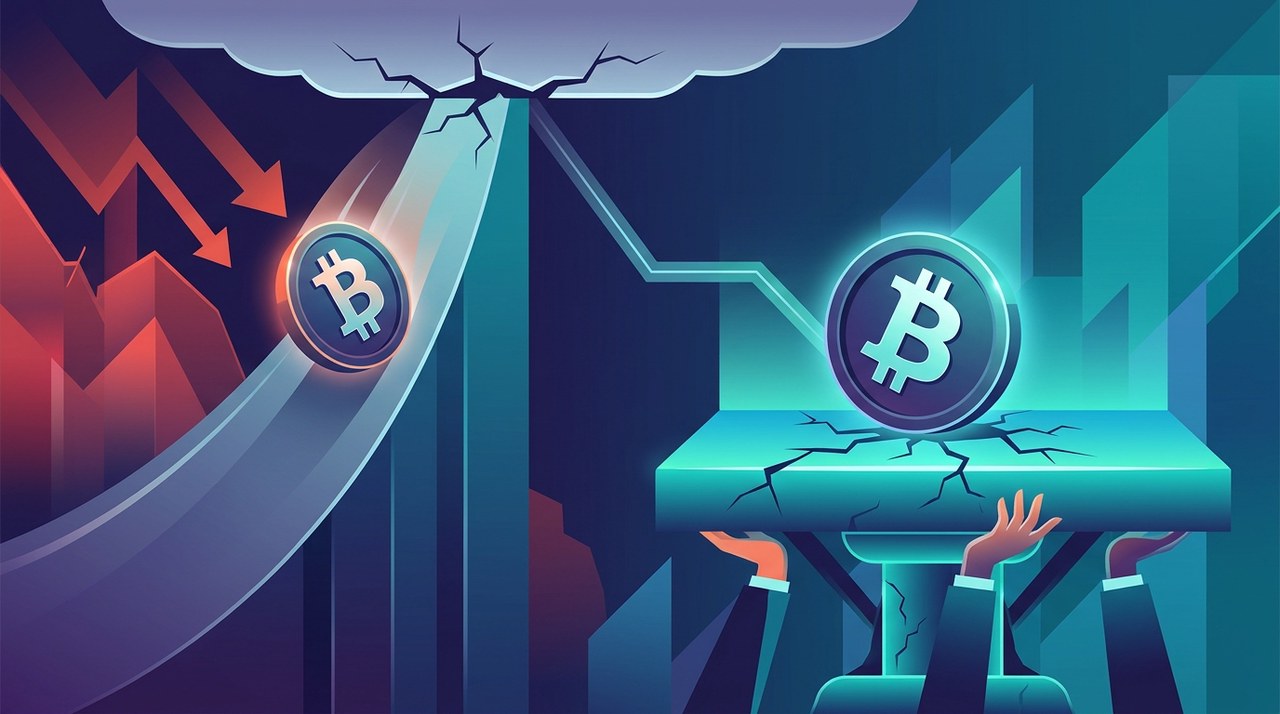
BitcoinBTC-0.01% recently attempted a recovery toward $81,000, but sellers quickly stepped in. This sharp rejection pushed the price back down to around $75,900, right near the lower edge of its daily demand zone.
Buyers are now facing an important test to defend these levels. At the same time, activity in the futures market is starting to show signs of heating up. Let's walk through what the charts and market sentiment are showing us.
The Daily Chart: Hovering Near Demand
On the daily chart, Bitcoin remains trading below the midpoint of its broader ascending channel. The recent push toward $81,000 ended with a strong red candle. This continues a pattern of lower peaks that has developed since September and October.
Bitcoin is currently sitting near the bottom of a demand zone between $75,000 and $78,000. A demand zone is a price area where buyers historically step in to buy.
While this area has attracted buyers before, the latest price bounce has been relatively small. The small daily candles following the aggressive pull-back suggest temporary stabilization, but there is no firm confirmation of a trend reversal yet.
Daily Chart Scenarios to Watch
Technical analysis relies on observing potential outcomes based on how price reacts to key chart areas:
- Downside Scenario: A sustained daily close below $75,000 would weaken the current demand zone. This could extend the price correction down toward the channel's lower boundary around $72,000 to $73,000.
- Upside Scenario: To improve the immediate outlook, buyers would need to push the price back above $78,000. Reclaiming the $80,000 to $81,000 range and the broken channel midpoint would suggest selling momentum is slowing down.
- Neutral Scenario: Continued sideways movement between $75,000 and $78,000 would indicate ongoing consolidation while the market waits for clearer direction.
The 4-Hour Timeframe: Descending Channel Structure
Zooming in to the 4-hour timeframe reveals that Bitcoin has been moving inside a descending channel. The recent rally touched the top of this channel within the $79,800 to $82,000 supply zone before reversing.
A supply zone represents an area where sellers tend to emerge. This rejection confirms that sellers are defending both horizontal resistance levels and the downward trendline.
Following that drop, Bitcoin entered a support zone between $74,900 and $76,300, where it is now consolidating near the channel's lower boundary.
4-Hour Key Levels
- Short-Term Relief: A sustained recovery above $76,300 would be a first sign of relief, potentially allowing price to move toward $77,000 to $78,500.
- Broader Reversal: For a larger move upward, Bitcoin would need to break out above the top boundary of the descending channel and reclaim the $79,800 to $82,000 supply zone.
- Breakdown Risk: A drop below $74,900 would indicate that buyers failed to defend the September demand region, which could accelerate price declines toward lower support levels.
Futures Sentiment: Heating Volume Signals
Traders also track metrics like the Futures Volume Bubble Map to gauge market activity. This tool categorizes futures trading volume into four stages: cooling, neutral, heating, and overheating.
Recent data shows 'heating' conditions around $75,800 to $76,000, following an earlier heating reading near the failed recovery around $80,500.
Heating signals near key support indicate increased participation in the futures market. However, volume metrics alone do not specify whether this activity comes from new short positions, defensive hedging, or buyers absorbing the sell-off.
Because the volume readings are categorized as 'heating' rather than 'overheating,' combined with the current price structure, the $75,000 region remains an active decision area for market participants.
Market Context and Risk Awareness
Digital asset markets move quickly and can experience high volatility. Technical patterns and support zones provide useful context for watching price structure, but they do not guarantee future movement.
Past performance of digital assets is not an guarantee of future performance. You can check current market trends on official tracking platforms such as Bitkub Market.
Latest blog posts

JPMorgan Stock Drops as Epstein Inquiry Resurfaces
JPMorgan Chase stock fell after news of a new Senate inquiry into its Jeffrey Epstein ties, highlighting key differences with decentralized Bitcoin.
|


Evernorth Data Reveals How RLUSD Drives XRP Ledger Trading
A report by Nasdaq-listed Evernorth shows that Ripple's RLUSD stablecoin isn't replacing XRP, with 92% of swaps trading against XRP.
|

 +2
Bitcoin Struggles at $76K as Altcoin Losses Mount
Bitcoin is nearing its fifth straight week in the red while major altcoins record steep double-digit drops after a chaotic market week.
|