Harmony (ONE) Rallies 13%: Can the Bounce Reach $0.003?
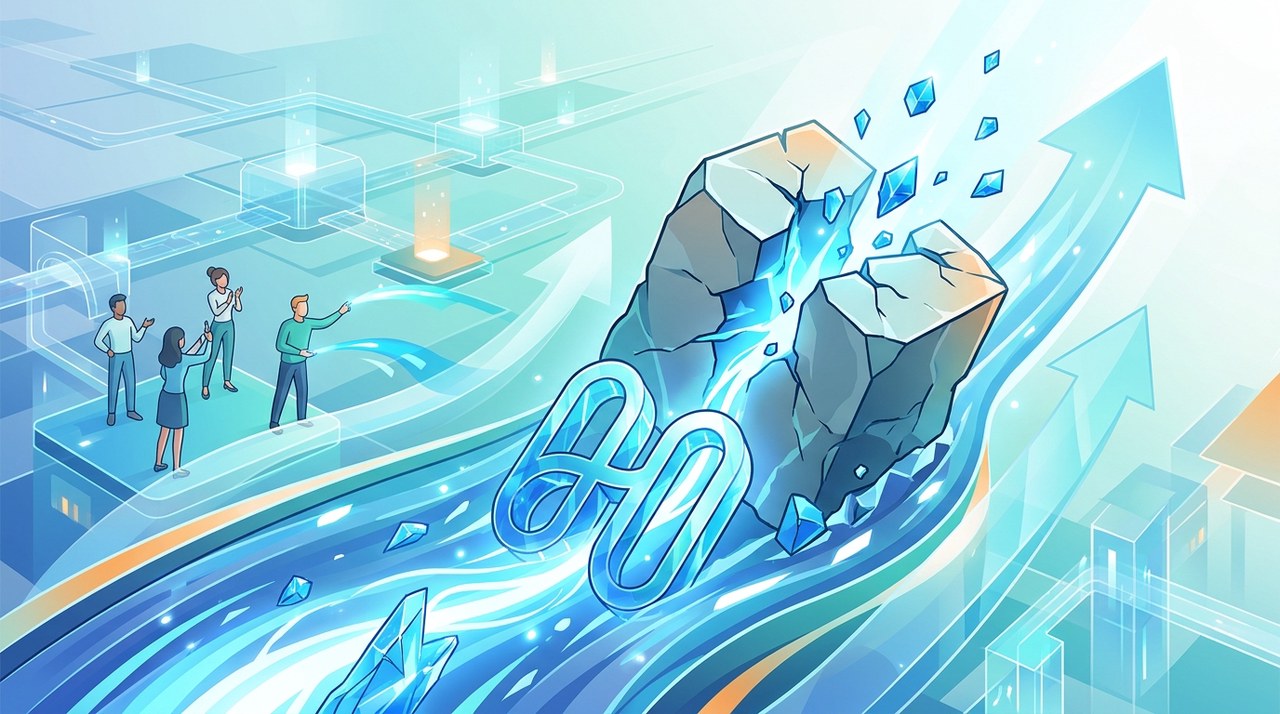
Harmony (ONE) Stages a 13% Rebound After Weeks of Decline
Harmony (ONE) is showing fresh signs of life after enduring weeks of heavy selling pressure. Following a steep downward trend from its September peak, the token posted a 13.14% gain over a single 24-hour period, climbing to $0.002041 as trading activity picked up sharply across exchanges.
This quick rebound has brought some encouragement to market watchers. However, because ONE gave back a large portion of its prior gains over recent months, it is still too early to tell if this short-term jump will turn into a long-lasting recovery.
It is important to remember that past performance of digital assets is not a guarantee of future results. Digital asset markets are highly volatile, and rapid price shifts can occur unexpectedly in either direction.
Under the Hood: Buyers Step In as CVD Turns Positive
To understand what is driving this price jump, technical analysts look at a metric called Cumulative Volume Delta, or CVD. Think of CVD as a scoreboard that tracks the net difference between aggressive market buying orders and market selling orders.
When CVD turns sharply positive, it means traders are actively placing market buy orders right away rather than waiting patiently with limit orders. The recent chart shows a steep upward spike in CVD, signaling that buyers have actively stepped back into the market to support ONE as it attempts to recover from its recent low points.
Thanks to this buying pressure, ONE pushed back above its 0.236 Fibonacci retracement level at $0.001715. Fibonacci levels act like temporary resting spots or hurdles on a price chart, and climbing back above this first line shows improving technical momentum.
Derivatives Activity: Open Interest Doubles to $20 Million
The spot market is not the only place showing activity. Traders are also returning to the derivatives market, where open interest for ONE has experienced a noticeable increase.
Open interest refers to the total number of active futures or options contracts that remain open in the market. In early November, ONE's open interest hovered around $10 million. Recently, that figure climbed close to $20 million.
- Fresh Market Capital: A simultaneous rise in price and open interest suggests new capital and fresh trading positions are flowing into the market.
- Not Just Short Covering: This combination indicates the move is being fueled by active new participants rather than traders simply closing out old positions.
- Two-Sided Positioning: Open interest includes both long (bullish) and short (bearish) contracts, meaning overall market exposure is expanding.
Because leverage works both ways, higher open interest can lead to elevated volatility. Whether buyers can remain in control will depend heavily on how trading volume evolves around the immediate resistance level.
Key Technical Levels and Potential Price Scenarios
Whether Harmony can extend its rally toward the $0.003 mark depends on how the token navigates crucial resistance and support zones. Here is an overview of potential upside and downside paths based on technical structure.
Bullish Scenario: Potential Upside Targets
If buying volume remains steady and broader crypto market conditions remain favorable, ONE could attempt to clear successive Fibonacci resistance levels:
- Target 1 ($0.002383): This represents the 0.382 Fibonacci retracement line and serves as the immediate obstacle. A sustained break above this level is necessary to confirm ongoing strength.
- Target 2 ($0.002922): Clearing the first target brings the 0.5 Fibonacci level into focus, pushing ONE close to the $0.003 benchmark.
- Target 3 ($0.004200): If upward momentum accelerates across altcoin markets, ONE could test the lower boundary of its major supply zone between $0.004200 and $0.005208.
- Target 4 ($0.005208): This upper level marks a major resistance zone where significant selling pressure previously occurred during September.
Bearish Scenario: Downside Support Levels
Conversely, if buying interest peters out or profit-taking steps in near resistance, ONE could face a pullback to lower support zones:
- Immediate Support ($0.001715): Buyers must defend this level (the 0.236 Fib line) to maintain the short-term bullish structure.
- Secondary Support ($0.0010 - $0.0011): A daily close below $0.001715 would weaken the rebound, opening potential downside toward this lower price band.
- Major Downside Risk ($0.000636): If broader market weakness intensifies, ONE could eventually retest deeper support near $0.000636. Analysts often highlight $0.001650 as a stop-loss reference point for risk management.
Final Thoughts for Market Watchers
Harmony's 13% gain shows that traders are returning to the asset, supported by positive CVD spikes and growing open interest. However, sustained recovery depends on breaking above $0.002383 while protecting support at $0.001715.
Investors should keep in mind that altcoins remain highly sensitive to overall market shifts. Past performance of digital assets is no guarantee of future results. You can stay updated with digital asset movements by viewing market updates at Bitkub Market.
Latest blog posts

Bitcoin Faces Key Support Test After Rejection Near $81K
Bitcoin is consolidating near $75.9K after a sharp rejection at $81K, placing key daily and 4-hour technical levels under close observation.
|

JPMorgan Stock Drops as Epstein Inquiry Resurfaces
JPMorgan Chase stock fell after news of a new Senate inquiry into its Jeffrey Epstein ties, highlighting key differences with decentralized Bitcoin.
|


Evernorth Data Reveals How RLUSD Drives XRP Ledger Trading
A report by Nasdaq-listed Evernorth shows that Ripple's RLUSD stablecoin isn't replacing XRP, with 92% of swaps trading against XRP.
|