


Black Monday Explained: Will Wall Street Crash on Oct 19?
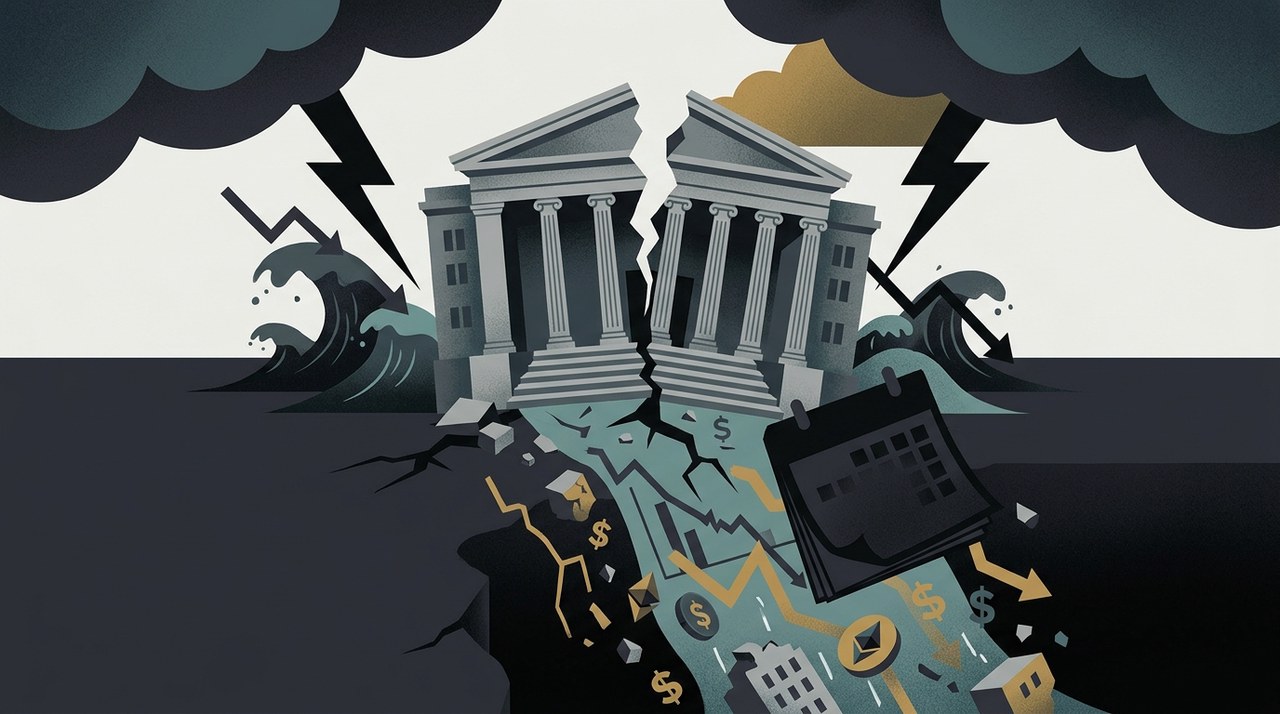
What Is Black Monday and Why Is It Trending Again?
If you have been scrolling through social media recently, you might have noticed the term Black Monday trending across financial and crypto communities. Traders and investors are keeping a close eye on Wall Street ahead of the market opening on October 19, 2026.
Why is this specific date causing so much chatter? October 19 marks the 39th anniversary of the legendary 1987 stock market crash. A mix of weekend liquidations in tokenized AI stocks, soaring crude oil prices, and climbing bond yields has brought those old fears back to the surface.
Before we dive into what could happen next, let us break down what happened during the original crash and why today's markets are reacting so sharply.
A Look Back: What Happened on Black Monday in 1987?
On October 19, 1987, Wall Street experienced the single worst day in stock market history. The Dow Jones Industrial Average plummeted by 22.6% in just one trading session. To put that into perspective, that single-day percentage drop was far worse than any single day during the Great Crash of 1929, the market reopening after the September 11 attacks, or the 2008 global financial crisis.
The devastation was felt across all major market indices and spilled over into global economies:
- The S&P 500 index tumbled by 20.5% in a single day.
- The Nasdaq lost 11.4% of its overall value.
- Roughly $500 billion in US stock market value vanished into thin air almost overnight.
- International markets panicked: Hong Kong halted stock exchange trading for four days. When trading resumed, the Hang Seng Index crashed by 33%.
To keep the entire financial system from collapsing, the Federal Reserve stepped in quickly, issuing a public statement that it would supply liquidity to support the financial system.
Historical digital asset and financial market returns do not guarantee future performance. Investors should evaluate market conditions carefully.
Why Did the Stock Market Crash in 1987?
Economists and analysts agree that there was no single smoking gun behind the 1987 crash. Instead, several pressure points combined to create a perfect storm.
At the time, market reports highlighted rising geopolitical tensions in the Persian Gulf, growing fears of higher interest rates, and expanding concerns over the US trade deficit. Additionally, early forms of computer-driven automated trading—known as program trading—accelerated the sell-off.
On top of these structural factors, the market had enjoyed a massive five-year bull run without experiencing any healthy pullbacks. News coverage on the evening of the crash repeatedly focused on one powerful emotional factor: pure panic. Once fear took complete control and orderly trading broke down, selling pressure simply fueled more selling.
Wall Street Brakes: How Circuit Breakers Protect Markets Today
To prevent a sudden 22% plunge from ever happening again, US exchanges created safety mechanisms called circuit breakers in 1988. You can think of circuit breakers as emergency brakes designed to pause trading when prices fall too far, giving investors a moment to catch their breath.
Under today's rules, market-wide circuit breakers pause trading based on the percentage drop in the S&P 500:
- Level 1 (7% drop before 3:25 PM ET): All US stock trading is halted for 15 minutes.
- Level 2 (13% drop before 3:25 PM ET): A second 15-minute trading pause is triggered.
- Level 3 (20% drop at any time during the day): Trading is completely shut down for the remainder of the day.
In addition, CME Group limits overnight price moves for S&P 500 futures contracts to a maximum of 7%.
These circuit breakers were triggered for the first time on October 27, 1997, when the Dow dropped 554 points and market trading closed 30 minutes early. Regulators later updated and tightened the rules in 2013 after safeguards failed during the May 2010 'Flash Crash'.
More recently, during the heightened economic uncertainty of March 2020, the Level 1 circuit breaker was tripped four times in just eight trading days. However, the severe Level 3 (20% drop) breaker has never been hit in history.
Why Are Traders Worried About October 19 Again?
With the anniversary approaching, several macroeconomic warning signs have put investors on high alert. Here is a snapshot of the current environment:
- Oil Prices Spiking: Brent crude oil reportedly closed near $110 per barrel on Friday, driven by reports of Ukrainian strikes on oil facilities near St. Petersburg.
- High Volatility: The VIX index, often called Wall Street's fear gauge, reached a four-month high.
- Rising Yields and Inflation: US Treasury yields continue to climb alongside stubborn inflation figures.
- Banking Sector Stress: Banking shares recorded losses, while unconfirmed rumors circulated regarding financial trouble at an AI-focused fund.
Commenting on the market conditions, crypto entrepreneur Ran Neuner highlighted that approximately $1.9 trillion has been wiped out from US technology stocks.
Fund manager Adrian Day noted that today's market conditions share several similarities with 1987. He pointed out elevated interest rates, worries over the US dollar and federal deficit, and an artificial intelligence sector that many analysts view as overvalued.
However, Adrian Day also provided important nuance, noting that bond yields have not yet risen enough to trigger a massive capital rotation out of stocks and into long-term US Treasuries. He added that the government's most recent 10-year Treasury auction saw strong demand from buyers.
Weekend Liquidations Hit Tokenized Stocks
While traditional US stock exchanges remain closed on Saturdays and Sundays, crypto markets and tokenized real-world assets trade continuously 24/7.
Over the weekend, perpetual futures contracts linked to major AI and semiconductor stock prices experienced sharp sell-offs, dropping by as much as 5% in seconds.
According to tracking data from CoinGlass, approximately $51.6 million in leveraged chip-stock derivative positions were forcibly liquidated in a brief 10-minute window. Derivatives tracking popular companies and funds like Micron, SanDisk, and SOXL were among the hardest hit.
What Does All of This Mean for Bitcoin?
As tokenized AI stock contracts tumbled, major cryptocurrencies like Bitcoin (BTCBTC-0.47%) and EthereumETH-2.19% initially dipped alongside them before quickly recovering lost ground.
Market data revealed that BTC and ETH funding rates remained relatively neutral throughout the fluctuation. This suggests that traders were not overly leveraged in either direction heading into the trading session.
It is crucial to remember that crypto markets do not have circuit breakers. Digital assets operate around the clock, meaning any market reaction starts long before Wall Street's opening bell.
If stock markets face heavy selling pressure when trading opens, several macro factors—such as forced margin liquidations, surging bond yields, and a broad risk-off sentiment—could lead to downside pressure or increased price volatility for Bitcoin. Thin liquidity in off-hours trading can make these movements significantly sharper.
Conversely, if traditional stock markets remain stable and investor sentiment recovers, Bitcoin could hold its current levels or build momentum. You can keep track of live prices and market developments directly at Bitkub Market.
Key Indicators to Watch When Markets Open
As trading begins, investors across both traditional and digital asset markets will be paying close attention to these vital metrics:
- The Nasdaq Composite at US Market Open: How tech and AI shares open after weekend tokenized asset volatility.
- Oil Prices & Bond Yields: Whether crude oil and US Treasury yields continue climbing or cool off.
- Bitcoin Price Support: Whether Bitcoin can firmly maintain its recent technical support levels during equity market turbulence.
In conclusion, modern circuit breakers make an abrupt 22% single-day crash much harder to replicate on traditional exchanges, though they do not prevent losses below each halting threshold. Meanwhile, 24/7 crypto and tokenized asset markets operate without these mechanisms, making continuous risk management essential for all traders.
Latest blog posts

Ethereum Tests Key Support: What Is Next for ETH?
Ethereum dropped 7% over the past week and is testing a critical support zone near $2,360. Here is a clear breakdown of the key levels and liquidation risks.
|


Spot XRP and Solana ETFs Face Outflow Streak
Spot XRP ETFs ended a 13-week positive streak while Solana funds hit record weekly outflows. Here is a clear breakdown of the numbers and market context.
|
BTC vs ETH ETFs: Which Funds Saw More Capital Outflows?
Both Bitcoin and Ethereum ETFs faced net capital outflows last week as crypto prices dipped, but Ethereum funds suffered larger overall losses.
|