บทความ
Bitkub.com เปิดฟีเจอร์ Depth Chart บนแพลตฟอร์ม เว็บไซต์และมือถือ

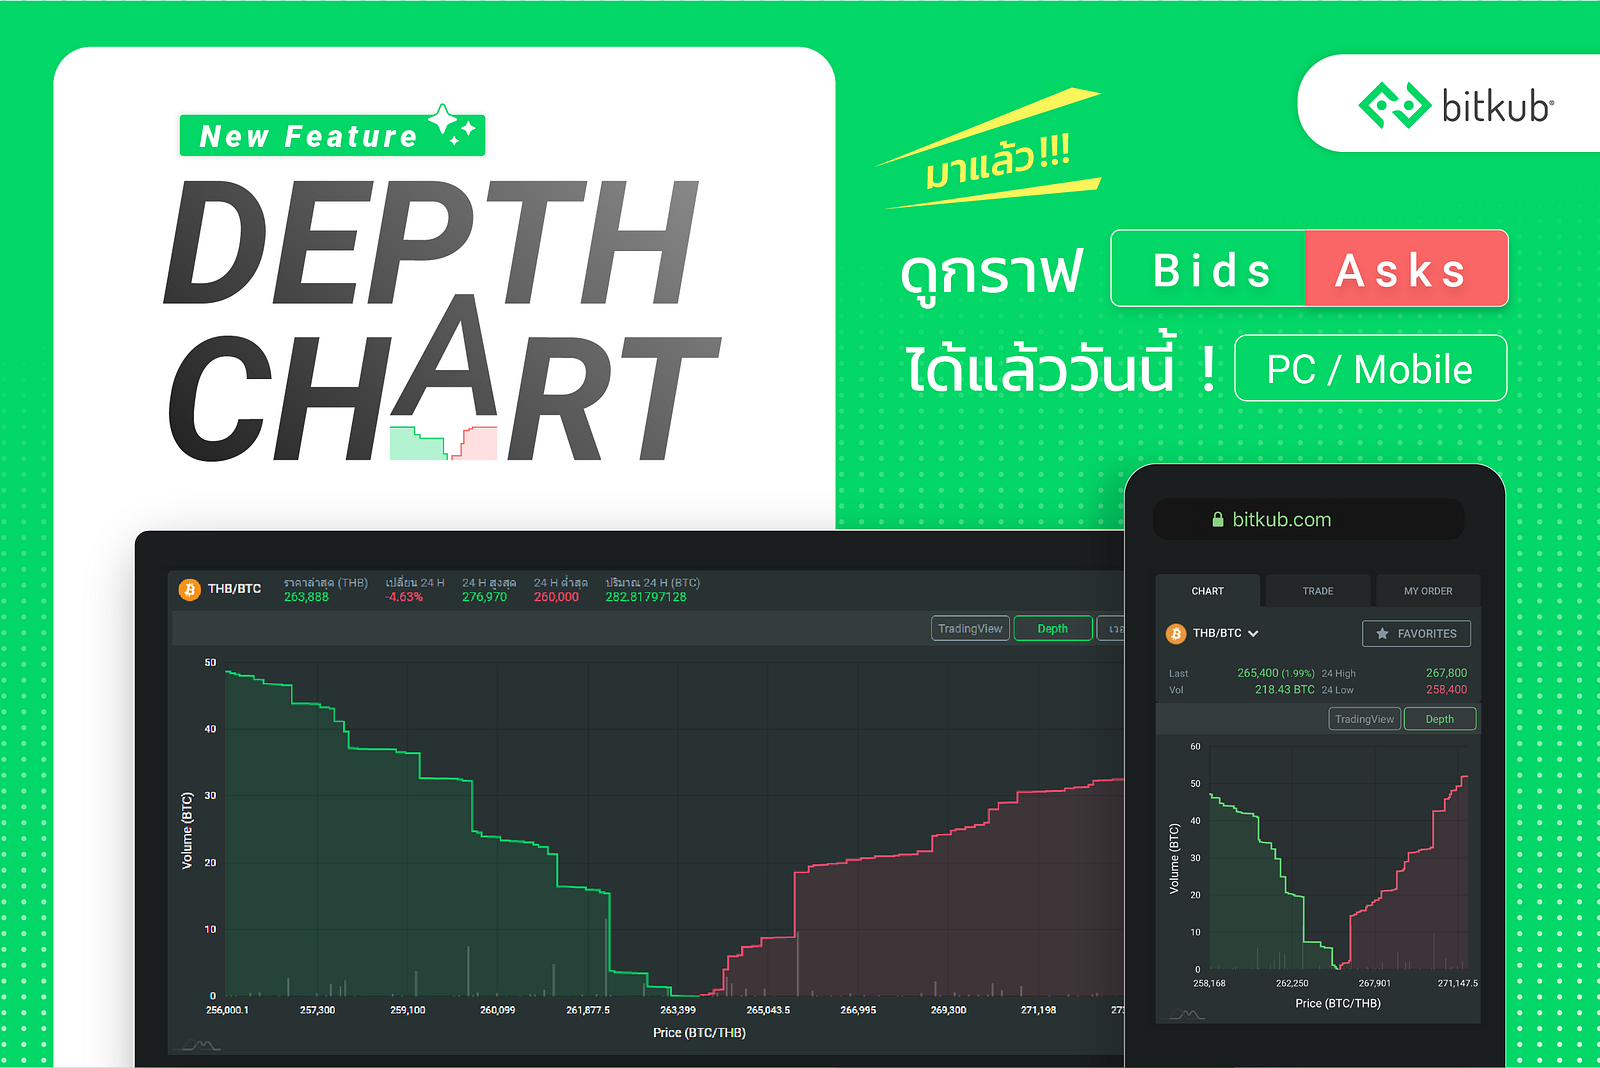
ตอนนี้ทุกท่านสามารถใช้งานฟีเจอร์ Depth Chart ได้บนเว็บไซต์และมือถือแล้ว (Mobile App รอนิดนึงนะ)
Check it out : Bitkub.com/market
Depth Chart คืออะไร ?
ปกติแล้วคนส่วนใหญ่มักจะใช้กราฟ Trading View เป็นวิธีการตั้งเส้นวิเคราะห์ราคาหลัก แต่สิ่งที่น่าสนใจของ Depth Chart คือท่านสามารถดูปริมาณการตั้งซื้อและตั้งขายของผู้ใช้ในตลาดได้
Depth Chart มีความสำคัญอย่างไร ?
กราฟประเภทนี้บ่งบอกถึงความต้องการของตลาดและปริมาณสินทรัพย์ที่ผู้คนตั้งออเดอร์ไว้ หรือ Demand/Supply นั่นเอง ยกตัวอย่างเช่น ถ้าหากฝั่ง Bids (ฝั่งสีเขียว) มีปริมาณมากกว่าฝั่ง Asks (ฝั่งสีแดง) แปลว่าความต้องการที่จะซื้อสินทรัพย์นั้นมีมากกว่าความต้องการที่จะขายสินทรัพย์
กราฟประเภทนี้เหมาะสำหรับ Trader รายวินาทีโดยเฉพาะเพราะมันสามารถบอกถึงสถานการณ์ของตลาดได้ทันที
Users can easily navigate to the depth chart via our trading platform on both PC/Mobile (Stay tuned for Mobile App)
Check it out : Bitkub.com/market
What is a Depth chart ?
Normally, traders analyze and predict the digital asset price via trading view graph while depth chart has other important implications to it. Traders can easily navigate the total volume of “bids” and “asks” orders in real-time at bitkub.com
How important is the Depth Chart ?
Depth chart helps users understand more about the current market demand and supply. Eg. If there are more “bids” orders (green side) than the “asks” orders (red side), it means that current demand to buy a certain digital asset is more than the demand to sell.
The Depth chart graph is recommended to hourly traders which they could directly understand the market situation.
ที่มา:
Medium