S&P 500 Hits Longest Losing Streak Since 2024: What's Next?
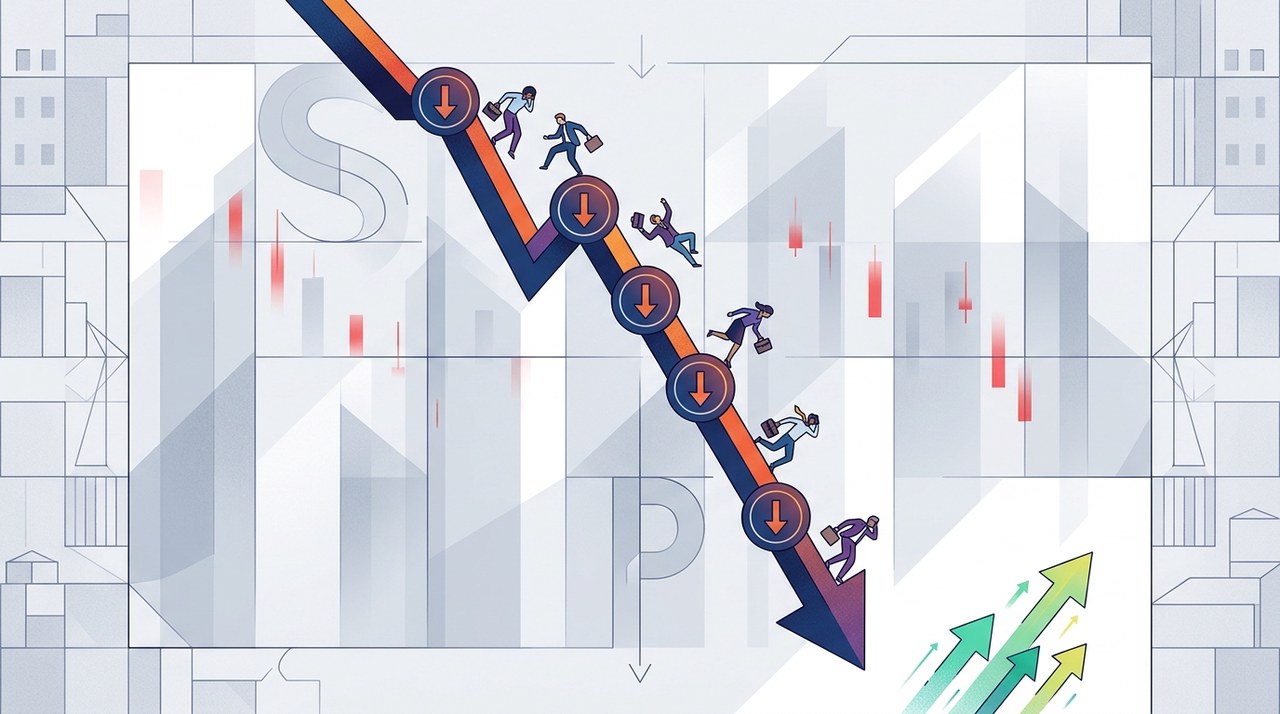
S&P 500 Completes Six Consecutive Days of Decline
The benchmark S&P 500 index logged its sixth consecutive losing session on Thursday, marking its longest uninterrupted slide since April 2024. The index fell 2% on the day after early advances in artificial intelligence stocks reversed course into late afternoon selling.
With Thursday's close, the index sits approximately 8.2% below its record peak set in October. The pullback was notably widespread across the broader market, with over 90% of S&P 500 member stocks declining and all 11 market sectors ending the day in negative territory.
For investors watching index funds, multi-day losing streaks often raise questions about short-term market momentum. Looking back at historical patterns can provide context on how markets have reacted under similar conditions in the past.
What Happened During the April 2024 Streak?
The last time the S&P 500 experienced a six-day decline was from April 12 to April 19, 2024. During that period, financial markets were grappling with persistent interest rate concerns, geopolitical tensions in the Middle East, and a notable selloff across major technology stocks.
That earlier losing streak ended on April 22, 2024, when the index bounced back with a gain of nearly 1%. The rebound occurred as geopolitical concerns temporarily eased and market participants turned their focus toward upcoming corporate earnings reports from major technology firms.
Subsequent inflation data released in mid-May 2024 showed signs of cooling, which revived expectations for potential Federal Reserve rate cuts. Just 26 calendar days after the six-day losing streak ended, the S&P 500 reached a new record high of 5,308.15.
Historical research highlights that six-day losing streaks have been relatively rare over the past decade. Past performance of financial indices, however, is not a guarantee of future market results.
Why Today's Market Landscape Differs From 2024
While the duration of the current losing streak matches the April 2024 event, several underlying fundamental factors present a different picture for today's market backdrop.
First, the depth of the drawdown is larger. The current decline stands at 8.2% from recent highs, compared to a drawdown of just over 5% during the April 2024 episode.
Second, macroeconomic expectations regarding central bank policy have shifted. According to market data from the CME FedWatch tool, interest rate futures currently reflect strong trader expectations for a potential Federal Reserve interest rate hike in December, contrasting with the rate-cut environment that supported equities in mid-2024.
Financial asset prices remain sensitive to shifting macroeconomic conditions. Investors should remember that elevated volatility can lead to rapid price swings across both traditional and digital asset markets.
Technical Indicators: The 200-Day Moving Average
From a technical standpoint, the S&P 500 closed below its 200-day moving average this week for the first time since early April. Traders often view the 200-day moving average as a long-term trend indicator, using it to gauge overall market trajectory.
Think of the 200-day moving average as a smoothed baseline that reflects the average price of an index over roughly ten months of trading. When prices trade above this line, the long-term trend is generally considered upward; trading below it often signals technical weakening.
The 200-day moving average line for the index currently sits near the 7,348 level, serving as a key reference point for technical analysts.
Analyst Perspectives: Defensive Positioning and Scenarios
Following the move below the 200-day moving average, Panmure Liberum strategist Joachim Klement announced that his team has shifted to a fully defensive portfolio stance. Under his systematic strategy, crossing below the 200-day line serves as a trigger to reallocate equity holdings into long-term government bonds.
Klement noted that his model calls for returning to stock allocations if the index reclaims and holds above the 200-day moving average line.
Evaluating AI Valuations and Downside Scenarios
Klement has previously raised concerns regarding valuations in the technology sector, particularly around artificial intelligence stocks. His team estimates that if an unwind in AI sector valuations were to coincide with persistent interest rate pressures, broad equity markets could experience drawdowns of 30% or more.
Conversely, if corporate earnings growth remains resilient and interest rate headwinds moderate, the index could reclaim its key technical levels and stabilize over the medium term.
For investors seeking equity exposure during volatile periods, Klement highlighted defensive consumer staples and pharmaceutical stocks, referencing UK-listed companies such as GSK and Unilever as potential hedging options.
He also noted that around historical market peaks, major indices have crossed their 200-day moving averages multiple times before establishing a clear direction, suggesting that short-term fluctuations around trendlines are common.
Key Takeaways for Market Observers
- Multi-Day Losing Streaks: The S&P 500 completed six straight down sessions, a pattern last seen in April 2024.
- Deeper Pullback: At 8.2% below peak levels, the current move is deeper than the ~5% drop experienced during the April 2024 slump.
- Technical Level: The index has moved below its 200-day moving average near 7,348, a level closely watched by trend-following strategies.
- Macro Shifts: Market expectations around Federal Reserve policy have adjusted, with traders monitoring potential rate decision developments.
As markets navigate shifting economic data and technical signals, investors should maintain a balanced perspective, review their risk tolerance, and evaluate diversified portfolio strategies.
Latest blog posts



Sui Launches Hashi to Unlock Bitcoin DeFi Potential
Sui has launched Hashi on its mainnet alongside over 20 partners, enabling Bitcoin holders to use 1:1 backed hBTC for lending, borrowing, and crypto strategies.
|
BlackRock Bitcoin ETF Sees Record $541M Outflow
BlackRock's IBIT spot Bitcoin ETF recorded its largest daily outflow of $541 million as crypto prices pulled back during a broader market sell-off.
|
SEC Charges 8 Firms Over $37M Fake Crypto Platform Fraud
The U.S. SEC has charged eight entities for allegedly defrauding investors of $37 million through fake crypto platforms, misleading ads, and forged filings.