


Hyperliquid (HYPE) Tests Crucial Support Zone Near $68-$70

Hyperliquid (HYPE) has been one of the few major cryptocurrency assets to stay relatively resilient during recent market weakness. While BitcoinBTC-3.81% trades roughly 15% lower year to date, HYPE remains significantly higher overall. However, that relative strength is currently undergoing a major test as selling pressure moves prices back toward key support boundaries.
At present, HYPE trades near $72, which is about 26% below its all-time peak of $97.99 reached on September 23. Market participants are watching closely to see whether the underlying bullish trend can hold or if a broader market correction is underway.
Bearish Technical Patterns Emerge on the Daily Chart
From a technical standpoint, the daily chart has displayed signs of consolidation and lower momentum. HYPE recorded a lower high on October 30 after a price movement linked to an Intercontinental Exchange (ICE) futures announcement stalled just below its record peak. Shortly after, the token registered its first lower low since its August breakout.
- Lost support at the 0.382 Fibonacci retracement level near $75, which previously held twice since September.
- Trading volume has steadily declined since peaking earlier in April and June.
- The Relative Strength Index (RSI) fell to around 35, marking its lowest reading since August.
Positive external headlines have not provided immediate price boosts. HYPE continued its slide despite the ICE announcement, exchange listings on Upbit and Bithumb on November 10, and Binance reopening HYPE withdrawals on November 8. Pressure was further added when two large holders sold approximately $109 million worth of HYPE on October 31. This comes at a time when market risk appetite remains muted, with the Crypto Fear & Greed Index sitting at 20.
Strong Protocol Fundamentals and Revenue Generation
While short-term technical charts look cautious, on-chain fundamental data highlights significant protocol activity. According to data from DefiLlama, Hyperliquid generated $68.68 million in revenue over the past 30 days. All of these proceeds are distributed to token holders via protocol buybacks, translating to an annualized revenue rate of approximately $825 million.
In addition, roughly 19% of gross revenue stems from USDCUSDC+0.21% reserve yields, providing a source of protocol income that does not depend entirely on trading transaction volumes.
"This is INSANE from $HYPEHYPE+2.25%. Annualized revenue just hit nearly $1B based on the last 30 days. With only 11 people on the team, that’s roughly 90M in revenue per employee. Plus, Coinbase AQA yield is adding another $15M/month on top. 99% of all this revenue goes straight to..." — Analyst Jussy
Despite these automated buyback mechanisms absorbing excess supply, they have primarily slowed down the selling pressure rather than halting the overall price adjustment.
Key Price Levels to Monitor: The $68–$70 Support Zone
HYPE is currently testing a significant technical support range situated between $68 and $70. Three distinct technical metrics converge within this specific price window:
- The 200-day moving average located near $69.
- The lower trendline boundary of the main ascending channel near $70.
- The 0.5 Fibonacci retracement level positioned at $68.08.
Buyers stepped in when the daily candle reached a low of $69.91. During a previous test of the 200-day moving average back in April, HYPE subsequently experienced a price rally starting in May. However, past performance of digital assets is not a reliable indicator of future market performance.
If market conditions lead to a daily close below this $68–$70 zone, technical analysts note the price could move toward the 0.618 Fibonacci retracement level near $61, which served as a consolidation range in June and July. Conversely, if buyers push the price back above the $75 mark, it would reduce short-term downside risks and help stabilize the overall market trend.
Latest blog posts
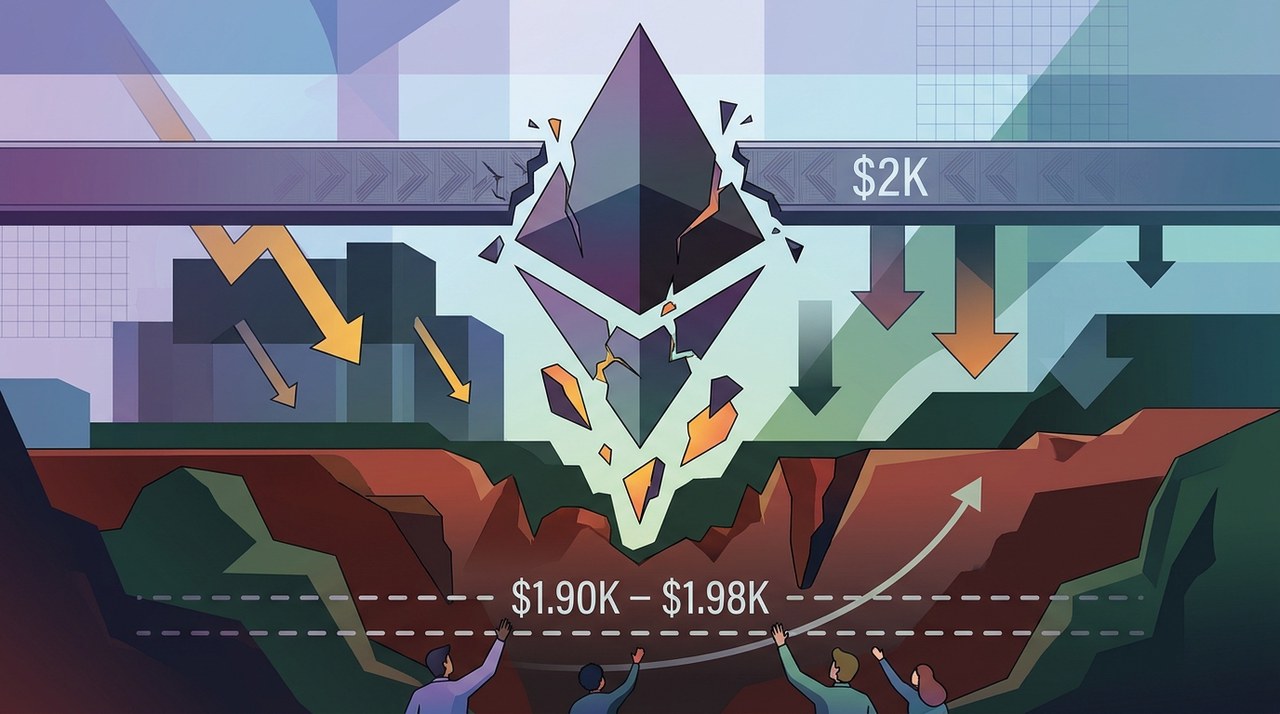

Ethereum Drops Below $2K: What Comes Next for ETH?
Ethereum has dropped below $2,000 and is now testing a major demand zone. Here is a breakdown of what key charts and liquidation heatmaps show.
|

XRP Price Analysis: Key Support Levels and Market Outlook
XRP recently fell 15% amid macroeconomic pressure and ETF outflows. Here is an overview of key technical support levels, whale buying activity, and market indicators.
|
Ethereum Foundation Sells ETH, But ETFs Sell 87x More
Ethereum Foundation wallet sales captured headline news, but US spot ETF outflows drove 87 times more selling pressure this month.
|