
Ethereum Drops Below $2K: What Comes Next for ETH?
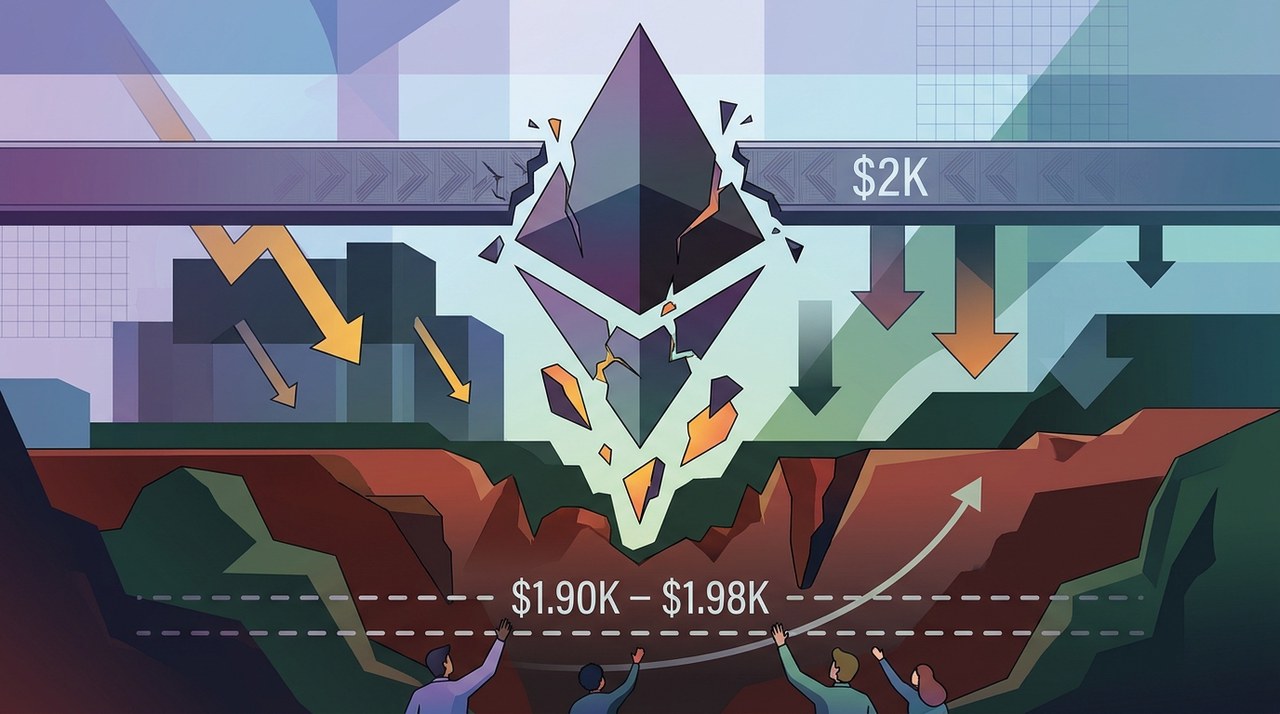
EthereumETH-3.50% Breaks Below $2,000: The Big Picture
Ethereum (ETH) has recently dipped below the $2,000 mark. The price is now testing a major daily demand zone sitting between $1.90K and $1.98K.
This area is notable because it overlaps with the price consolidation that happened right before August's rally. Historically, buyers stepped in around these levels, making it an important area to watch.
Daily Chart Analysis: Key Support and Moving Averages
On the daily chart, Ethereum extended its drop after breaking below an ascending channel. Attempts to bounce back higher lost momentum quickly.
During the recent selloff, ETH pushed down toward $1.94K, with a brief intraday wick falling beneath $1.90K. While buyers have shown some activity around $1.90K–$1.98K, there is no confirmed trend reversal yet.
ETH is currently trading below its key moving averages, which sit around $2.15K and $2.38K. Although these averages showed a bullish crossover earlier, the recent price breakdown indicates that upward momentum was not sustained. These moving averages may now act as resistance during future recovery attempts.
Potential Downside and Recovery Scenarios
- Downside Scenario: If Ethereum closes a daily candle below $1.90K, the current demand zone could weaken. This may open the door toward the August consolidation lows around $1.83K–$1.87K. A deeper support zone sits near $1.52K–$1.57K.
- Recovery Scenario: If buyers successfully defend the demand zone and pull price back above $2,000, ETH could try to stage a rally. However, the $2.20K–$2.29K supply zone remains a major barrier overhead.
4-Hour Chart: Short-Term Trends and Supply Zones
The 4-hour chart highlights an accelerated decline after ETH broke through the lower boundary of its descending channel.
A brief recovery attempt toward $2.04K–$2.10K failed, establishing that area as a near-term supply zone before sellers pushed prices below $2,000.
While we see a slight bounce near $1.90K, buyers have not yet broken the pattern of lower highs and lower lows on shorter timeframes.
Levels Needed for Short-Term Stabilization
- First Sign of Support: Reclaiming the $1.98K–$2.00K range would be the first hint that prices are stabilizing.
- Stronger Confirmation: Moving above $2.04K–$2.10K would offer stronger evidence that immediate selling pressure is easing.
- Risk Warning: Until these overhead levels are reclaimed, any short-term bounce remains vulnerable to further pullbacks.
Liquidation Heatmap: Where Are Traders Positioned?
Looking at the Binance liquidation heatmap, there is a notable concentration of long liquidations sitting below current prices around $1.80K–$1.86K.
If ETH fails to hold its current demand zone, a move into this $1.80K–$1.86K area could trigger forced long liquidations, potentially increasing short-term market volatility.
Liquidation bands reflect areas where forced position closures may occur, rather than guaranteed buyer support floors.
Overhead, liquidation clusters remain near $1.94K–$1.98K and further up around $2.10K–$2.20K. If ETH manages a sustained move back over $2,000, short liquidations in those higher zones could help fuel a potential rebound.
Summary and Market Outlook
Ethereum remains in a cautious technical position. Market participants are watching closely to see if buyers can protect the $1.90K floor.
A clear move back above $2,000 could relieve pressure, while losing support at $1.90K brings lower price levels into focus.
Past performance of digital assets is not an guarantee of future results. You can monitor live market pairs directly via the Bitkub ETH Market.
Latest blog posts



Hyperliquid (HYPE) Tests Crucial Support Zone Near $68-$70
Hyperliquid faces a key technical test around $68-$70 as buyers defend price levels despite strong protocol revenue.
|

XRP Price Analysis: Key Support Levels and Market Outlook
XRP recently fell 15% amid macroeconomic pressure and ETF outflows. Here is an overview of key technical support levels, whale buying activity, and market indicators.
|
Ethereum Foundation Sells ETH, But ETFs Sell 87x More
Ethereum Foundation wallet sales captured headline news, but US spot ETF outflows drove 87 times more selling pressure this month.
|