
Bitcoin Breaks Midterm Election Pattern Set Since 2014
BitcoinBTC-0.28% Shifts Away from a Decade-Old Election Cycle Trend
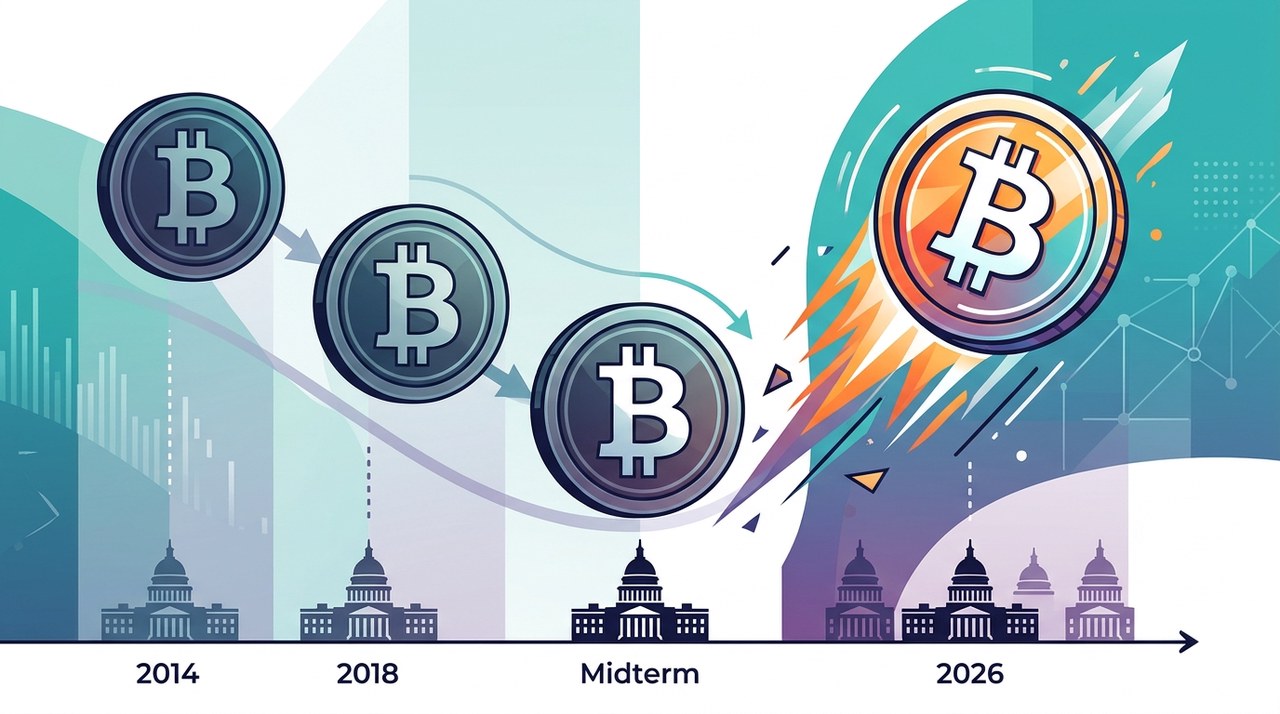
Bitcoin is breaking a price pattern connected to U.S. midterm elections that dates back to 2014. As market watchers prepare for the upcoming U.S. midterm election on November 3, 2026, historical trends are no longer playing out as expected.
For years, crypto analysts tracked how Bitcoin behaved around major U.S. political events. Midterm election years historically signaled market bottoms or consolidation periods. However, recent market dynamics suggest that the traditional cycle is changing.
Understanding the Historical U.S. Midterm Election Pattern
To understand why this shift matters, it helps to look at how Bitcoin performed during past midterm election years:
- 2014 Midterms: Bitcoin was in a prolonged bear market following the Mt. Gox collapse, forming a cyclical bottom.
- 2018 Midterms: The crypto market experienced a severe drawdown, with Bitcoin reaching its cycle low of around $3,100 shortly after the elections.
- 2022 Midterms: The market faced heavy downward pressure amid broader macroeconomic tightening and major industry defaults.
Historically, midterm years were marked by accumulation or price corrections, setting up strong upward moves in the years immediately following the election. Past performance of digital assets is not an indicator of future results. You can review live market dynamics on Bitkub Market.
Why the 2026 Midterm Cycle Is Different
Several key structural factors explain why Bitcoin is deviating from its historical 4-year election trajectory as we move toward November 3, 2026:
1. Institutional Capital and Spot ETFs
The approval and growth of spot Bitcoin ETFs have fundamentally changed market liquidity. Institutional flows operate on global macroeconomic drivers rather than retail-driven halving or political cycles.
2. Central Bank Policies and Liquidity
Global interest rate decisions and liquidity cycles from central banks currently exercise a stronger influence on digital asset prices than seasonal election calendars.
Market Scenarios and What Analysts Expect
Because historical patterns are shifting, financial analysts evaluate multiple potential market paths depending on broader conditions:
- Bullish Scenario: If central banks lower interest rates while institutional ETF adoption expands, Bitcoin could maintain steady momentum through the election period rather than experiencing a typical midterm bottom.
- Bearish Scenario: If global inflation rebounds and monetary policy tightens, digital assets could face sharp corrections, as high volatility remains a key risk.
- Sideways Scenario: Increased institutional participation could lead to longer periods of range-bound consolidation with lower overall volatility.
Key Takeaways for Crypto Observers
While historical cycles provide helpful context, market structures evolve over time. Investors should focus on fundamental metrics, risk management, and overall macroeconomic trends rather than relying solely on past calendar patterns.
Latest blog posts


NEAR Drops 7% as Token Issuance Cut Approved
NEAR Protocol fell 7% following a community vote to cut token issuance by 11.8 million NEAR over two years, a reduction valued at $45 million.
|

ETHGas Wants to Bring Wall Street Futures to Ethereum
ETHGas is introducing advance block reservations to Ethereum, but validator non-delivery risks currently lack financial compensation.
|
Is BlackRock Selling Bitcoin? Behind the $405M IBIT Outflow
BlackRock did not dump its Bitcoin holdings. Recent $405.3 million IBIT outflows were driven by client redemptions following security and market concerns.
|