
XRP Drops Below $0.99: Key Price Levels to Watch Next
What Happened to XRP's $0.99 Support Level?
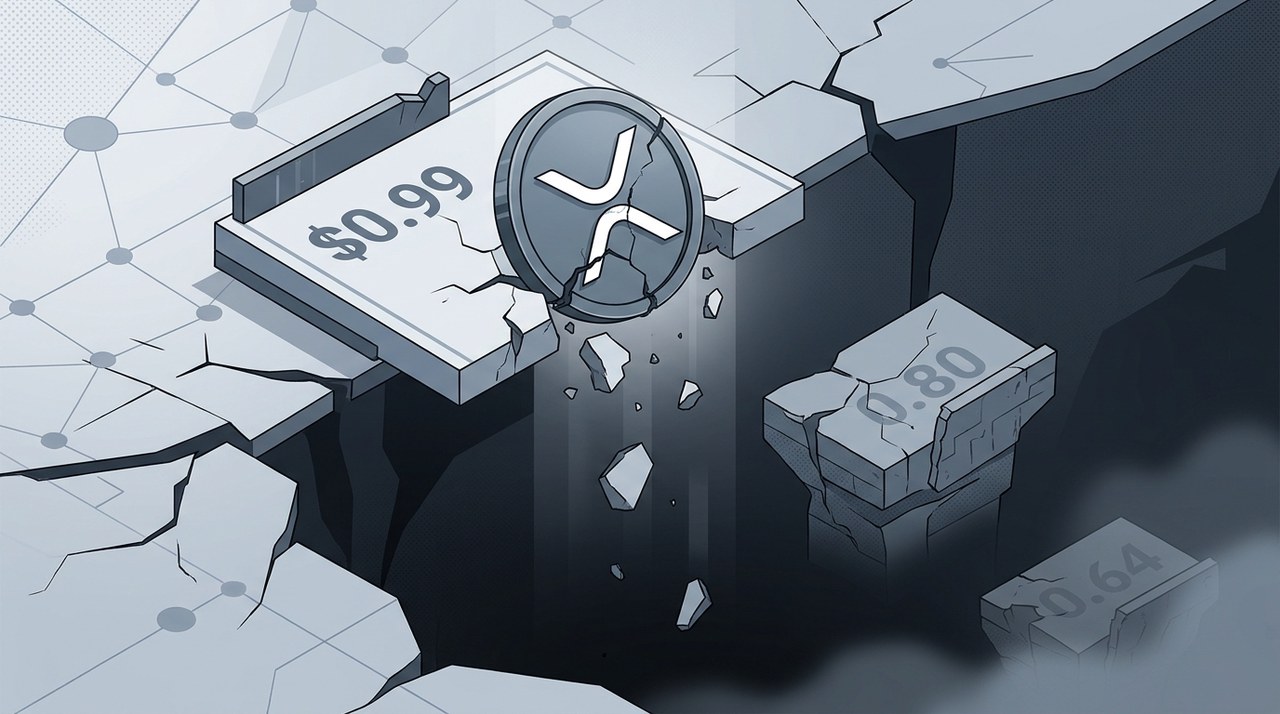
XRPXRP-8.34%, one of the most widely followed cross-border payment tokens, has slipped below a key support level at $0.99. For several weeks, traders and analysts viewed this price level as a crucial safety floor for buyers.
In technical analysis, a support level acts like a trampoline. When prices drop to that floor, buyers often step in to push the price back up. However, when that floor breaks, it signals that selling pressure has temporarily overpowered buying demand.
With the $0.99 level lost, market observers are warning that XRP could face a deeper price correction unless buyers quickly step back into the market.
Ali Martinez Points to Lower Downside Targets
Popular crypto analyst Ali Martinez highlighted the breakdown on social media platform X. He explained that $0.99 represented the lower boundary of XRP's broader trading channel.
According to Martinez, failing to hold this level suggests that a more extended price correction may already be underway. He identified two primary downside target zones if the selling pressure continues:
- $0.80 Support Zone: The first major area where buyers might attempt to defend the price.
- $0.64 Lower Support Zone: A deeper extension of the current downward trend if broader market weakness persists.
Martinez noted that for this bearish setup to weaken, XRP would need to climb back above $0.99 and re-establish that price point as a solid support level.
It is important to remember that these technical targets depend on market conditions. If trading volume increases and broader crypto market sentiment improves, XRP could invalidate these downside projections. Conversely, if selling volume accelerates, prices could test these lower zones.
ChartNerd's Take: The Resistance Challenge Between $1.03 and $1.14
Ali Martinez is not the only analyst watching these critical levels. Market analyst ChartNerd also shared insights regarding XRP's recent price structure.
ChartNerd pointed out that XRP faces significant resistance between $1.03 and $1.14. In trading terms, resistance is like a ceiling that prevents prices from rising easily.
If XRP fails to reclaim and move past this $1.03 to $1.14 resistance zone, ChartNerd believes the asset could slide lower toward $0.89 or even $0.70.
This scenario highlights the ongoing tug-of-war between buyers and sellers. Without sufficient buying momentum to clear upper resistance levels, market pressure can push prices toward lower historical supports.
Can Oversold Conditions Trigger a Relief Rally? EGRAG CRYPTO Weighs In
Despite the recent downward move, not all technical indicators point strictly downward. Prominent XRP analyst EGRAG CRYPTO offered a slightly more nuanced perspective on the market's structure.
EGRAG CRYPTO noted that XRP's Relative Strength Index (RSI) has entered oversold territory. Think of the RSI like a stretched rubber band. When an asset becomes heavily oversold, it sometimes snaps back in the opposite direction for a temporary rebound.
Additionally, XRP is currently testing the lower boundary of a chart pattern known as a falling wedge. Falling wedges are often viewed by technical analysts as potential bullish reversal patterns.
However, EGRAG CRYPTO urged caution, noting that oversold signals do not guarantee an immediate price bottom. He outlined key scenarios to keep an eye on:
- $0.915 Support Line: Described as a critical line in the sand for short-term buyers.
- $0.80 Retest Level: If $0.915 fails to hold, the price could drop further toward $0.80.
- Relief Rally Targets ($1.20 - $1.25 and $1.40): If buyers step in at current levels, XRP could potentially experience a temporary bounce back toward $1.20 or even $1.40, a region EGRAG terms his zone of confidence.
For a sustained recovery to occur, buyers would need to generate consistent volume to push past overhead resistance. Without clear buyer entry, downside risks remain present in the short term.
Understanding Market Volatility and Risk Management
When navigating periods of heightened market volatility, understanding how technical support and resistance work can help put price movements into perspective.
Downside targets like $0.80 or $0.64 are not guaranteed outcomes, but rather statistical areas where historical trading activity suggests buyers or sellers might react. Similarly, upside targets like $1.20 to $1.40 require significant market participation to materialize.
Crypto markets can experience rapid changes in sentiment due to broader macroeconomic factors, news events, and overall market liquidity shifts. Managing risk carefully and relying on verified market data remains essential when analyzing digital asset markets.
Past performance of digital assets is not a guarantee of future results. Investors can monitor real-time price updates and market trends on Bitkub Market.
Latest blog posts



 +2
Bitcoin, Ethereum, and XRP Dip as Bear Market Fears Grow
Bitcoin dropped below $56,000 on Saturday alongside Ethereum and XRP, pushing liquidations higher while analysts monitor key macro and chart levels.
|
Fidelity Strategist Stays Bullish as Bitcoin Dips Below $58K
Fidelity strategist Jurrien Timmer remains bullish on Bitcoin despite a dip below $58,000, pointing to long-term power law models and network adoption.
|


NEAR, LINK, and LTC Test Key Support Levels
Near Protocol, Chainlink, and Litecoin face ongoing selling pressure as prices test critical technical support levels.
|