
Worldcoin Nears Key $0.30 Support: What Traders Are Watching

Understanding WorldcoinWLD-3.70%'s Current Price Level
Worldcoin (WLD) is approaching a price level that could determine its next direction on the charts.
The token is currently trading around $0.3371 on the daily chart. This comes after a pull back from levels above $0.50 recorded in recent months.
As the price declines, it is moving closer to a highlighted support zone between $0.30 and $0.32.
Why the $0.30 Support Zone Matters
In technical analysis, support zones are price levels where buyers have previously stepped in to halt price declines.
The $0.30 mark is highlighted as a key horizontal level because WLD previously found support in this area.
Some analysts interpret this current chart structure as potential accumulation. However, accumulation remains a market interpretation and requires validation from actual trading activity.
Can Buyers Defend the $0.30 Level?
Holding above $0.30 could provide the technical basis for a price rebound. However, historical price reaction at a support level does not guarantee future support.
Traders generally look for increased buying volume and a sustained move away from the support zone before considering a bullish outlook reliable.
Conditional Price Targets and Alternative Scenarios
If buying pressure strengthens and the $0.30 support level holds, technical chart setups identify several potential upside targets:
- First resistance level: $0.36
- Second resistance level: $0.44
- Third resistance level: $0.52
- Extended target: $0.66
These price targets depend on specific market conditions, including sustained buying momentum and positive broader market sentiment.
Conversely, if buyers fail to hold the $0.30 level and selling pressure increases, the bullish technical setup weakens significantly, opening up potential for further downward price adjustments.
Navigating Crypto Market Volatility
Technical support levels provide reference points for market behavior, but crypto markets remain inherently volatile and subject to sudden trend shifts.
Investors should consider both upside possibilities and downside risks when monitoring chart developments.
Past performance of digital assets is not an guarantee of future performance. You can review current price charts on platforms such as Bitkub Market.
Latest blog posts


Prediction Markets Favor $70,000 Dip for Bitcoin by Year-End
Traders on prediction platforms like Polymarket and Kalshi favor a Bitcoin drop toward $70,000 over a $100,000 rally as 2026 comes to a close.
|
ATOM Holds Support Zone as Paxos Brings New Infrastructure Access
Cosmos (ATOM) trades near long-term chart support between $1.23 and $1.385 while securing a major distribution partnership via Paxos integration.

Ripple CEO Responds as XRP Community Frustration Grows
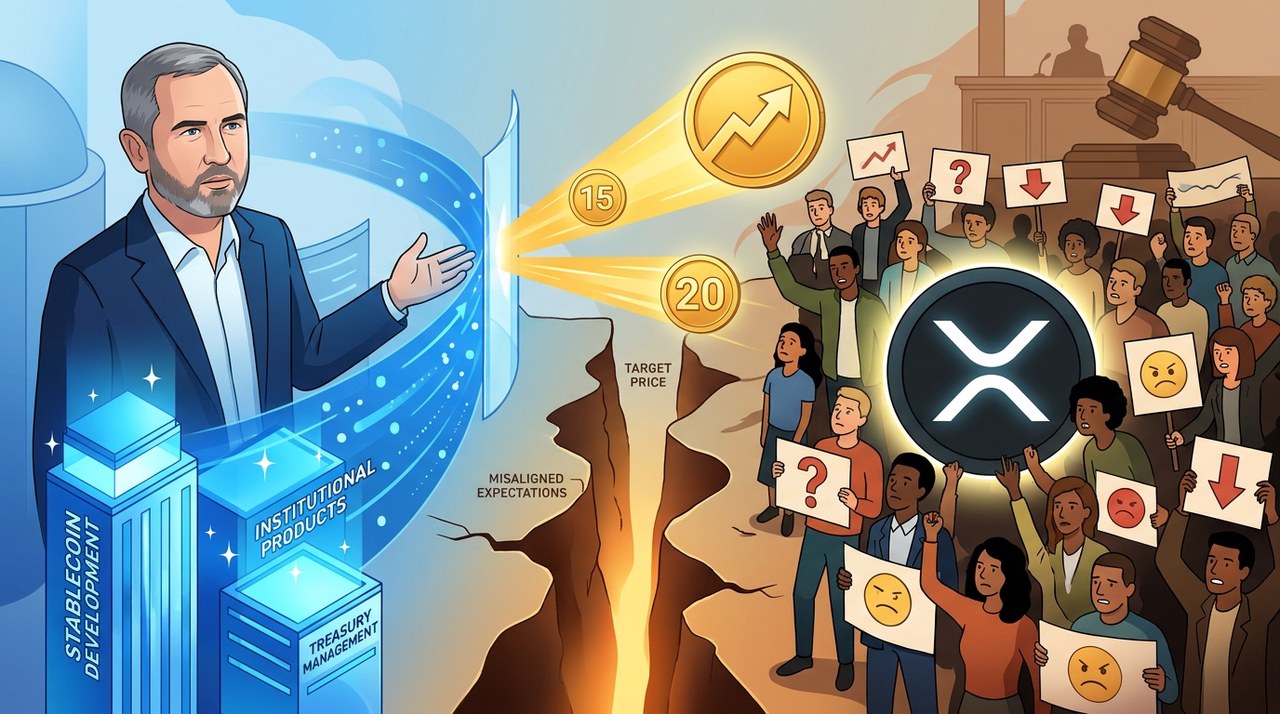
Ripple CEO Brad Garlinghouse has defended XRP's role following community concerns over the company's focus on stablecoins and institutional products.
|